- Bitcoin Rainbow Chart shows BTC signals accumulation.
- Prediction models and analysts forecast a major BTC rally in the next few months.
Bitcoin [BTC] rallied over 68% in Q1 2024, but Q2 headwinds have eaten part of the gains. With BTC down 7% in Q2 and stuck within the $60K—$71K price range, gauging whether it is overvalued or undervalued using the Bitcoin Rainbow Chart is crucial.
On a YTD (Year-to-Date) basis, BTC has added over $22K, translating to 50.3% gains. However, Q2 headwinds, including interest fears and Middle East tensions, spooked investors and partly explained last week’s drawdowns.
Now that Bitcoin is back above $66K, the big question is: Is it too expensive, or is the current value a bargain?
Bitcoin Rainbow Chart signal “accumulate”
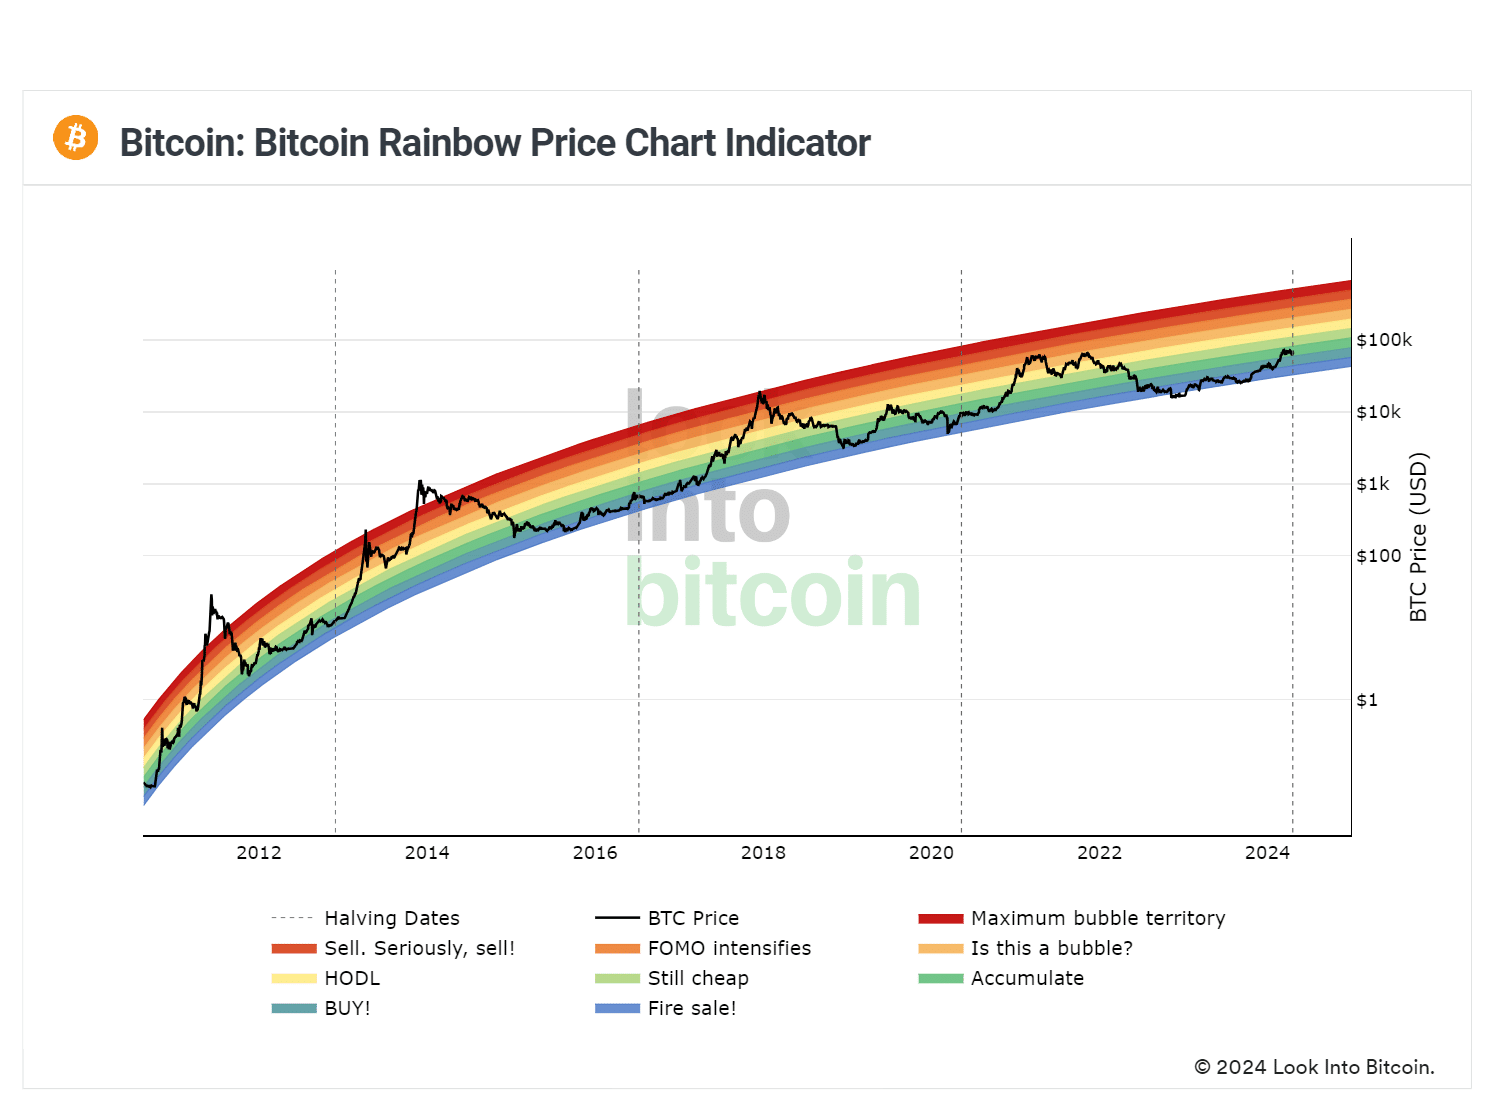
Source: Source: Look Into Bitcoin
According to the Bitcoin Rainbow Chart, BTC’s current price level was within a zone referenced as “accumulate.”
The Bitcoin Rainbow Chart visually represents Bitcoin’s valuation based on historical data. Notably, it’s a logarithmic scale that includes color bands showing buying (blue, green) and selling (orange, yellow) zones.
In the past three halving cycles, BTC was massively undervalued immediately after the halving. Although the current BTC price level is slightly higher on the scale than the last cycles, it is within the “accumulate” zone.
So, BTC is still undervalued and not overheated, per the Bitcoin Rainbow Chart.
Additionally, the Stock-to-Flow (S/F) model indicates more upside potential for Bitcoin’s price. The model evaluates BTC’s future prices by dividing its circulating supply by the annual number of mined coins.
The model has been able to predict BTC prices with fair variance in the past. It forecasts that BTC will cross $100K in Q3 2024 and hit over $450K at the end of 2025.
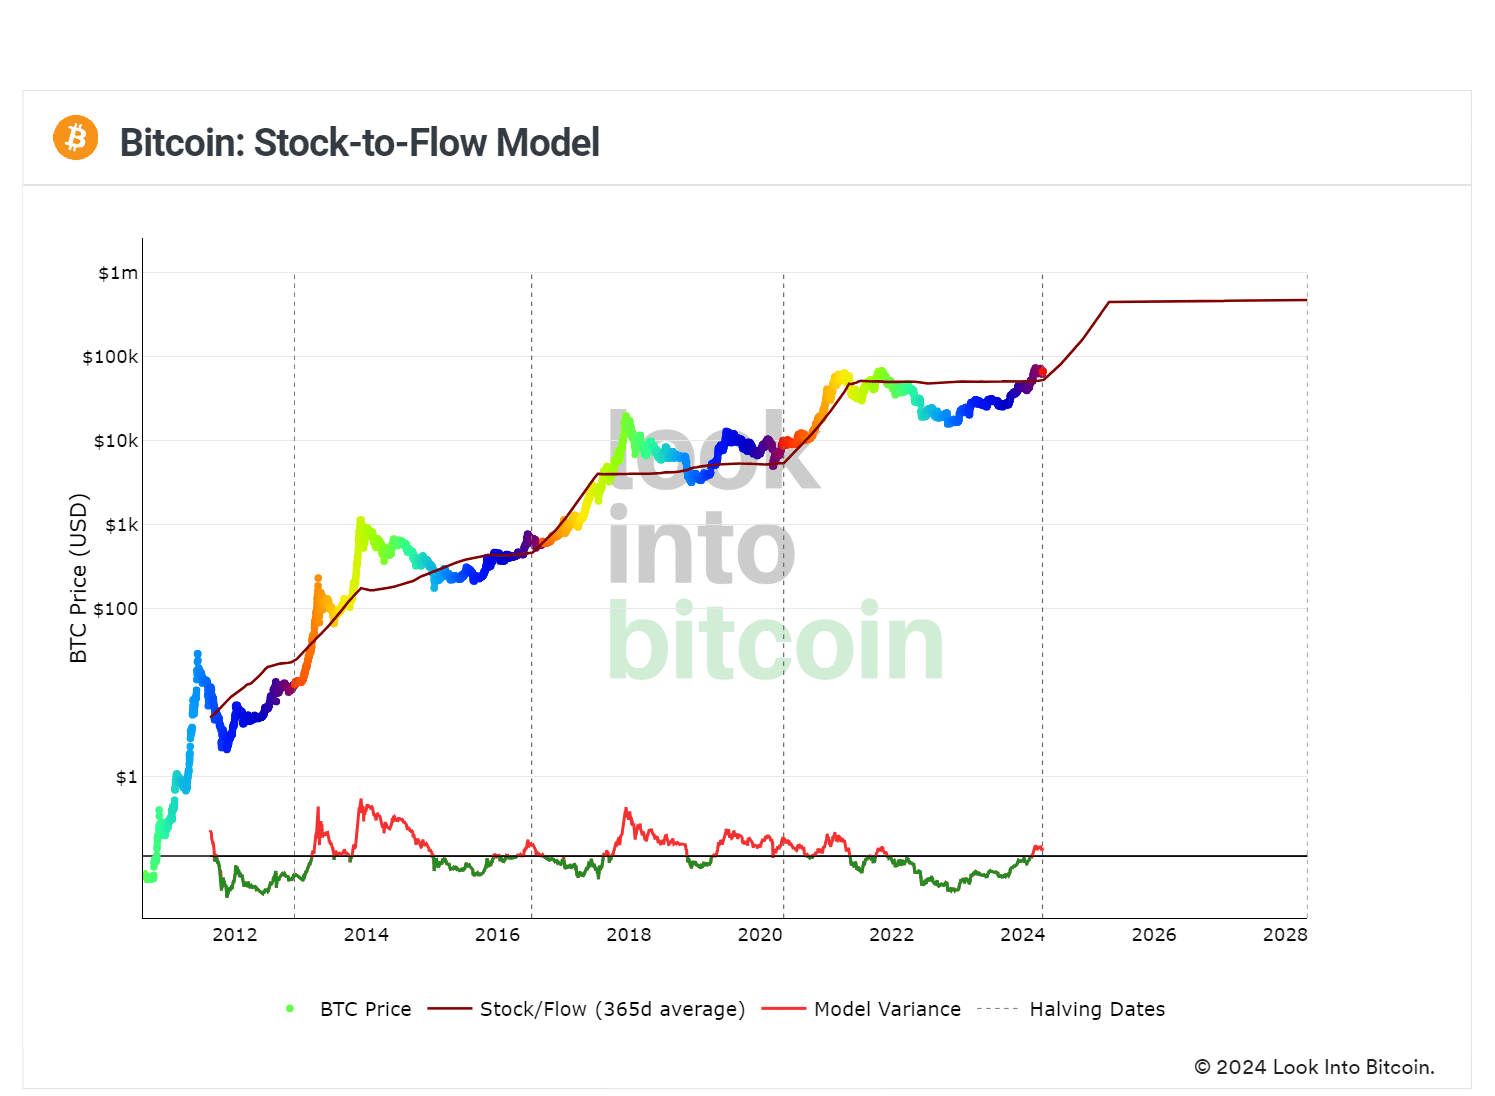
Source: Look Into Bitcoin
However, given the new US spot BTC ETF factor and macro pressures, cross-referencing S/F projections with nuanced expert analysis can also offer crucial insights.
Why analysts think BTC can hit $200K in 18-24 months
Interestingly, Standard Chartered predicts that Bitcoin can hit $200K in the next 18 – 24 months.
In a recent interview, Geoff Kendrick, head of digital assets research at Standard Chartered, saw spot BTC ETFs maturity as a driving factor;
“I anticipate from the the start of this year to when the ETF market in the US market matures, you’ll get between $50B to $100B in inflow. So far, we have $12B. That can happen in 18-24 months.”
Correlating BTC ETFs and gold, Kendrick noted that gold’s price went 4.3x when its ETF flows matured. Per Kendrick, if BTC ETF flows maturity follows gold’s path, then,
“that could get us to the $150K – $200K range.”
Similarly, in mid-March, Bernstein analysts revised the BTC price projection from $90K to $150K by mid-2025, citing “more-than-expected” flows from spot BTC ETFs.
According to Ki Young Ju, the founder of CryptoQuant, “new whales” have now doubled their BTC accumulation spree.
“The new whales’ initial investment in #Bitcoin is almost twice the old whales’ cumulative total.”
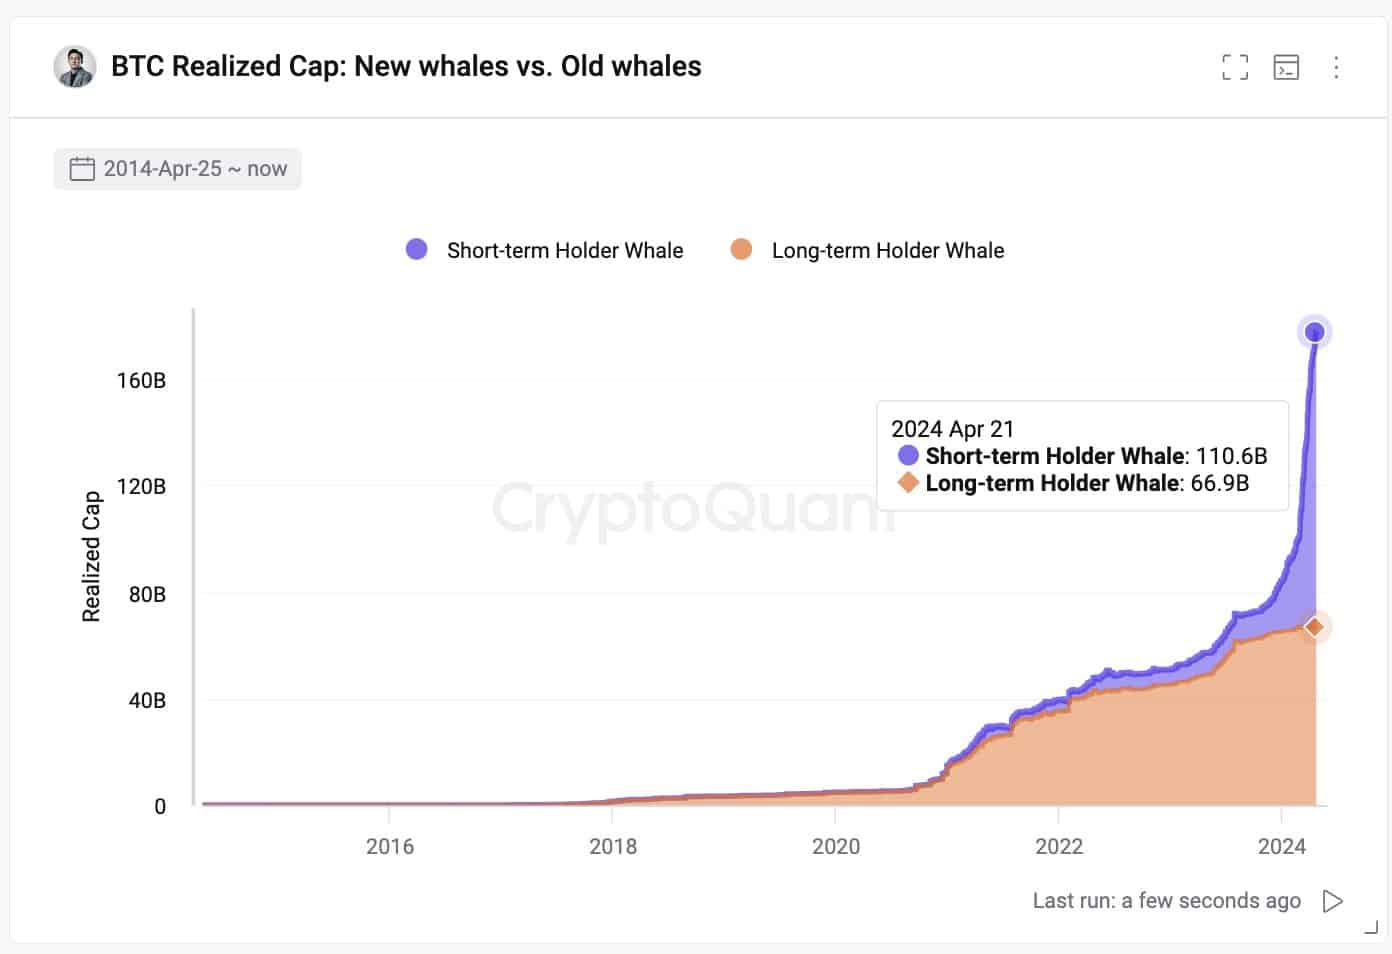
Source: X/Ki Joung Yu
However, the massive whale demand is not the only good news for BTC’s future prices. The macro overview is aligned, too.
BitMEX founder and CIO of Maelstrom, Arthur Hayes, foresees a favorable summer for BTC, citing the “sovereign bonds market” issues. In a recent blog dubbed “Left Curve,” the CIO noted;
“Rarely in markets do the things that got you here (Bitcoin from zero in 2009 to $70,000 in 2024), get you there (Bitcoin to $1,000,000). However, the macro setup that created the fiat liquidity surge that powered Bitcoin’s ascent will only get more pronounced as the sovereign debt bubble begins to burst.”
The CIO accurately predicted last week’s massive sell-off, citing the US tax season and Bitcoin’s halving.
Although Middle East tensions also played a part in last week’s drawdowns, Hayes’ projections show that the macro overview looks great for Bitcoin from summer onwards.
Read Bitcoin [BTC] price prediction 2024 -2025
That said, Bitcoin price prediction models, including the Bitcoin Rainbow Chart and analysts, all point to further upside for BTC in the next few months.
If these predictions are confirmed, then current BTC prices are a massive bargain.