
- M2 Money Supply’s positive trend suggests greater liquidity could boost Bitcoin
- Despite this optimistic signal, other metrics point to bearish pressures on the cryptocurrency
After major corrections, Bitcoin is finally seeing some positive movement on the price charts, with BTC up by almost 5% in just 24 hours. In fact, at the time of writing, BTC was trading at $62,850. This upswing has seen the cryptocurrency’s price climb from the $57,000 range within a mere few days. What this also means is that the cryptocurrency’s market trend may finally be changing for the better.
This positive development coincided with a revelation by the co-founder of Apollo Sats, who recently highlighted a significant shift in the M2 Money Supply. According to the exec, the M2 Money Supply has now transitioned from negative to positive year-over-year, as of 1 May.
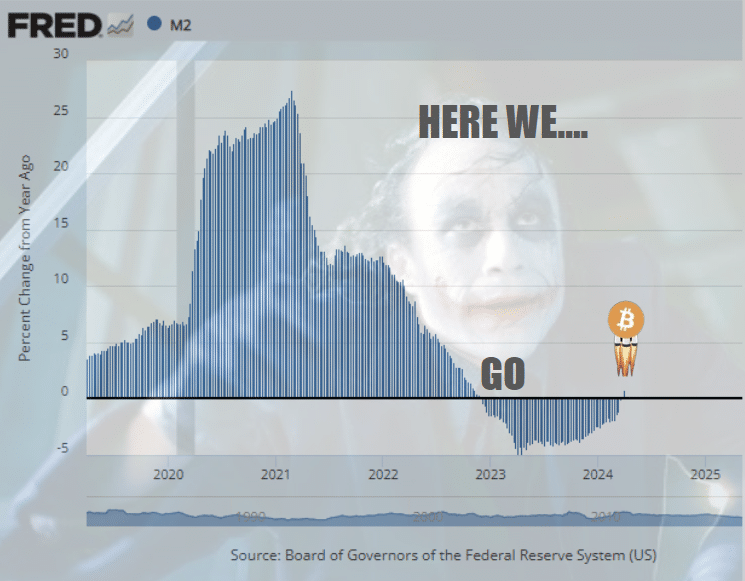
Source: X
This is a crucial update, one suggesting an increase in the circulation of money, which historically has acted as a precursor to heightened investment in assets like Bitcoin during periods of rising inflation. Trader and financial author Oliver L. Velez commented on the same recently, stating,
M2 Money Supply is about to go ballistic, like it’s never done before. Can you say “Bŕrŕrrrr?” All I can say is, “buckle-up” and stackharder. Any and all dips are buyable. Consider them gifts and ignore the bozos calling for doom. We are nowhere near the end of btc’s bull.
Implications of M2 Money Supply’s shift on Bitcoin
The M2 Money Supply represents all cash and short-term bank deposits across the nation. Its transition into positive territory is a classic economic indicator that often leads investors to focus on assets that historically perform well during high inflationary periods.
In the realm of cryptocurrencies, such shifts have previously catalyzed superior performances, compared to traditional financial markets.
The latest positive adjustment in the M2’s supply has sparked speculation among crypto-traders about the potential for an extended rally in Bitcoin’s price.
Notwithstanding the optimistic outlook tied to the M2 supply’s positivity, however, it is essential to consider other market indicators that continue to point to ongoing bearish pressures.
For instance, an analysis by Glassnode revealed an increase in Bitcoin’s net outflows across all cohorts throughout April, indicating persistent sell-side pressure.
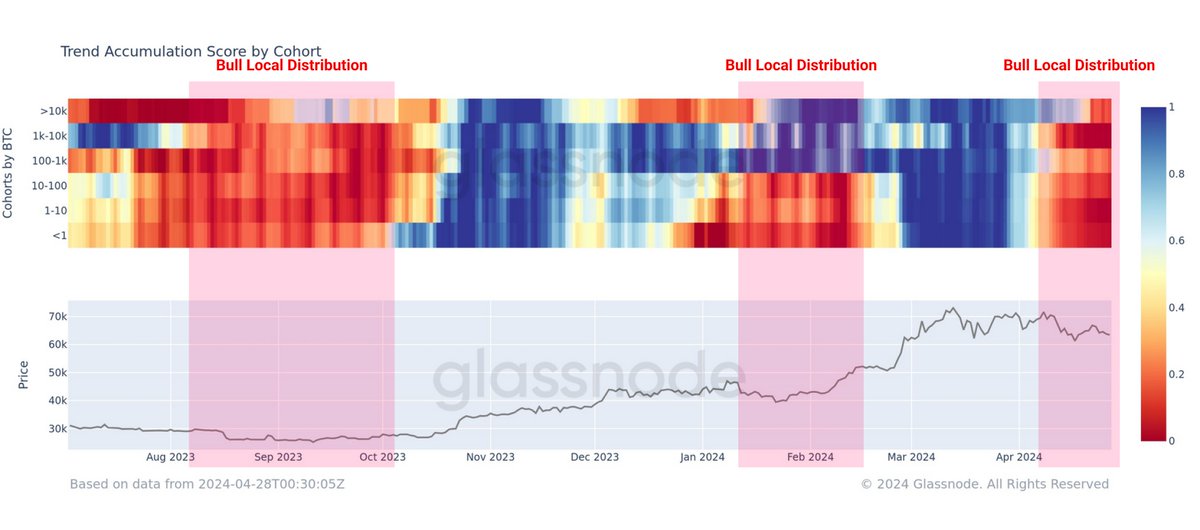
Source: Glassnode
Meanwhile, additional analysis of Bitcoin’s technical charts presented a mixed signal. On the 4-hour chart, Bitcoin recently encountered an order block, hinting at a potential price reaction or reversal. This scenario was further supported by the formation of a bullish spinning top candlestick pattern, followed by a bullish engulfing candle. This often precedes a reversal from bearish to bullish market conditions.
These chart formations suggest that while immediate bullish movements are possible, the broader market sentiment remains cautiously optimistic.
In fact, crypto analyst Ali Martinez reinforced this sentiment recently by highlighting a recent buy signal from Bitcoin’s Market Value to Realized Value (MVRV) ratio, adding another layer of outlook to the current market dynamics.