
- Mt. Gox has begun repaying creditors who suffered losses when it collapsed in 2014
- Ethereum fell to an intraday low of $2,825 and seemed to be on course for 4 consecutive daily red candles, at press time
Bitcoin, the world’s largest cryptocurrency, crashed to its lowest level since February earlier today as the market reacted to news of activity around a Mt Gox-linked wallet. In fact, such was the scale of the crash that BTC fell below $55,000 on the price charts, down over 9% on the weekly charts.
It wasn’t alone though, with Ethereum taking BTC’s lead. It recorded worse losses too, with ETH dipping below $3,000 to hit an intraday low of $2,820.
Whale activity also contributed to the losses
Ethereum’s freefall also appears to have been exacerbated by whales selling significant Ethereum (ETH) amounts to repay debts on their sunk bets.
In fact, on-chain data resource LookOnChain revealed that ETH’s price declines posed liquidation risks to Ethereum whales who longed ETH via Aave and Compound. For instance, the tool tracked an address selling 26,600 ETH to repay a debt on Aave in a post on X.
Liquidations
As expected, Friday’s market bloodbath resulted in nearly $650 million worth of cryptos, including $537 million in bullish bets, being liquidated in just 24 hours.
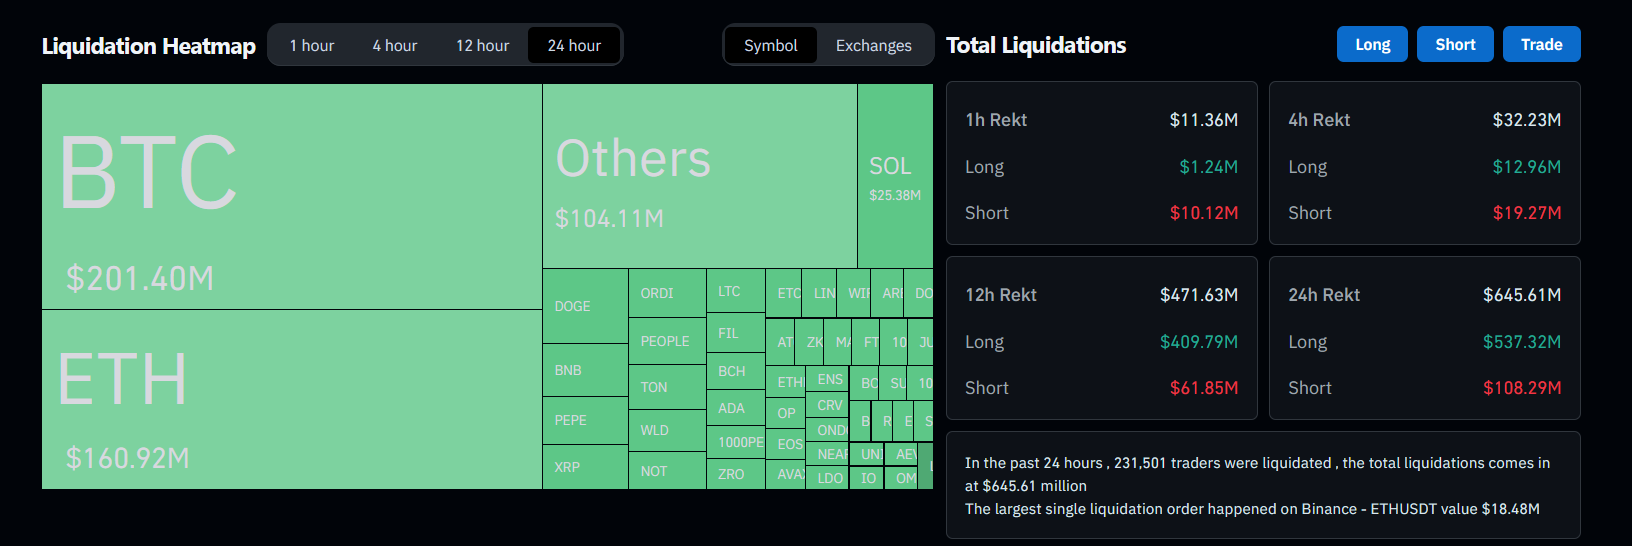
Source: Coinglass
Over $130 million worth of ETH long positions were forcibly closed in the 24 hours leading to press time too.
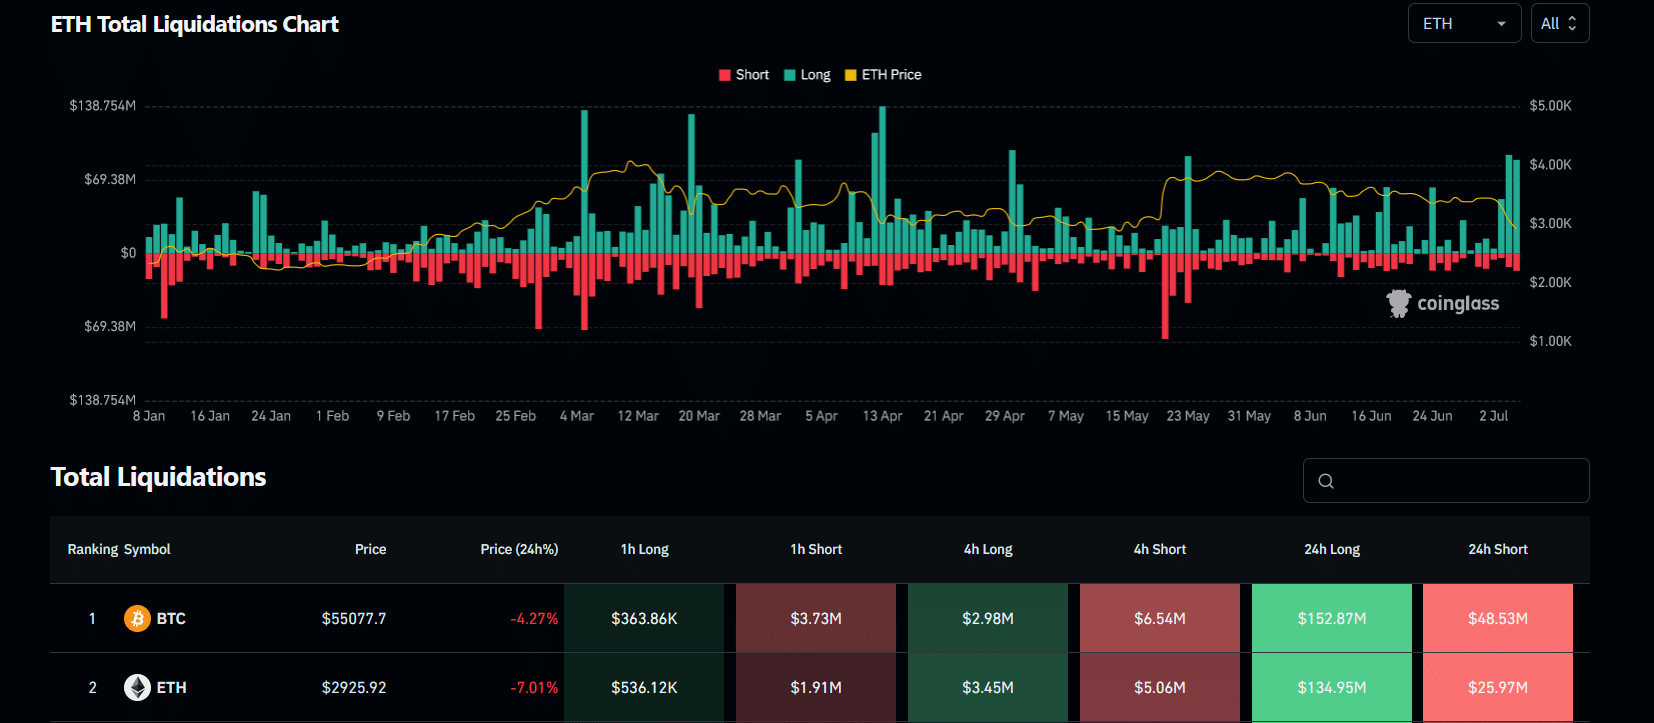
Source: Coinglass
Meanwhile, total ETH Futures open interest (OI) across top exchanges declined by almost 12% over the aforementioned period too – A sign of funds exiting the market.
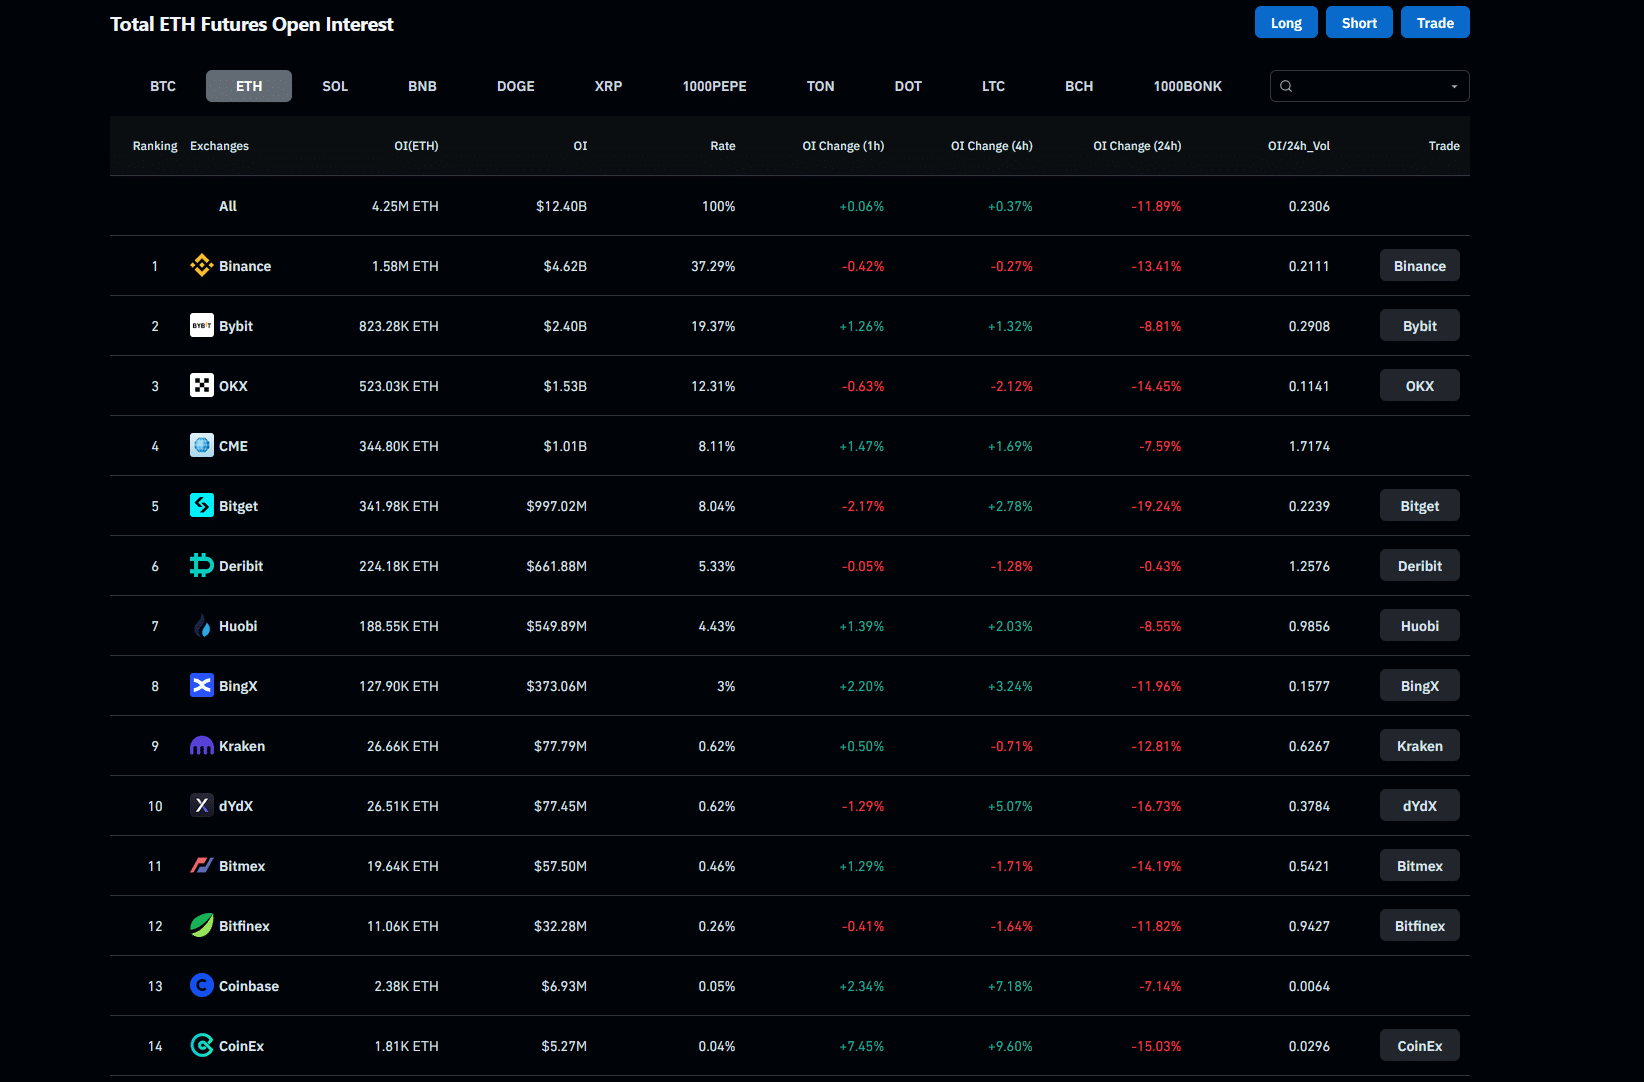
Source: Coinglass
Finally, Ethereum’s CME OI fell by 7.59% too, confirming bearish investor sentiment across the board.
ETH/USDT technical analysis
ETH/USDT losses, now extending to a fourth day, have piled pressure on the pair. Owing to the same, the pair breached key support levels at the height of the slump. ETH’s price slipped below the 50-, 100-, and 200-simple moving averages on the daily chart.
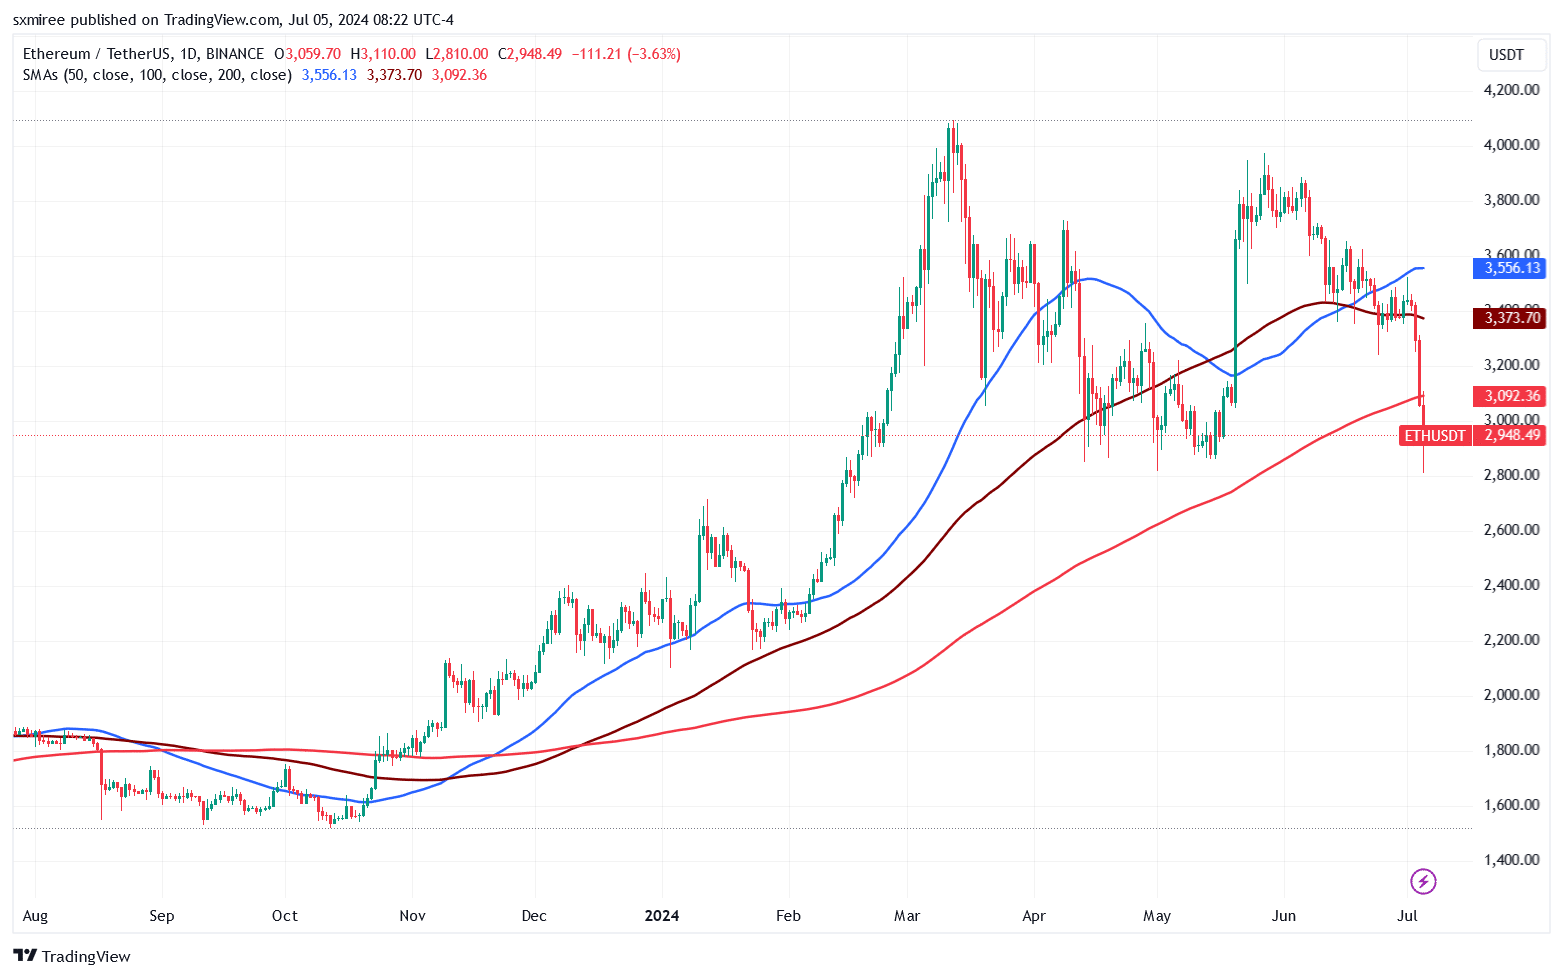
Source: TradingView
The last time ETH/USDT fell below all three trend lines on the daily timeframe was in August 2023. At the time, the crypto market saw losses occasioned by reports of Elon Musk’s SpaceX selling its Bitcoin holdings.
ETH was last spotted at $2,920, ranging 40% below its all-time high, according to CoinMarketCap. Ethereum’s subdued performance this week has strengthened a bearish outlook in the short term too.
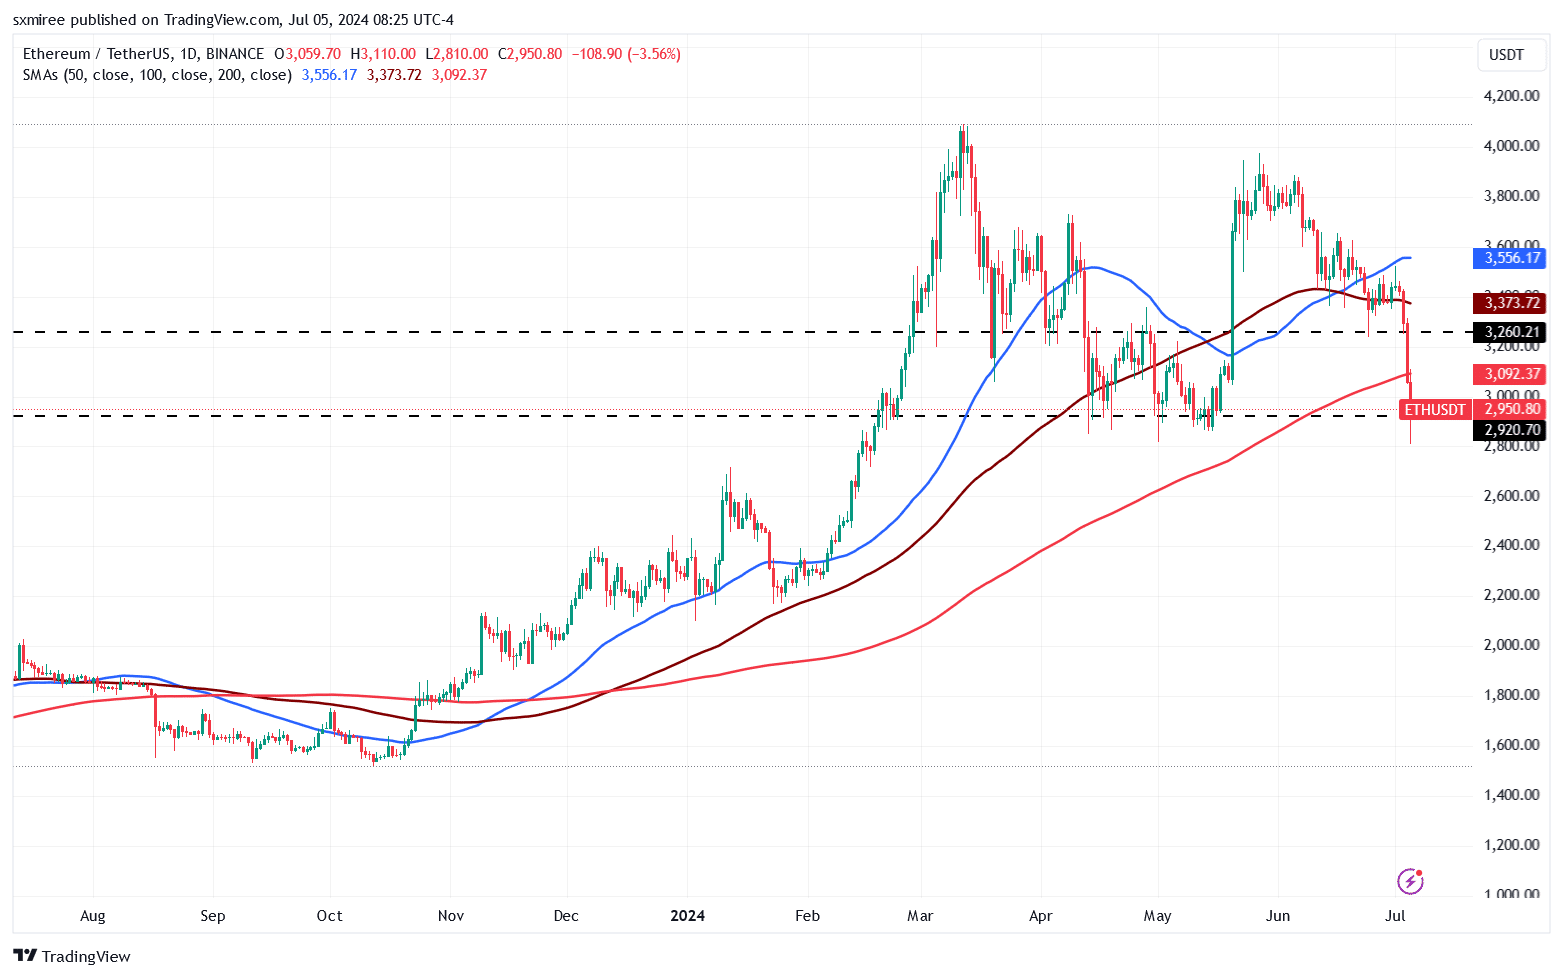
Source: TradingView
The ETH/USDT pair is now positioned to face resistance around the $3,200-level, which it previously contended between mid-April and mid-June.