
- Polkadot has seen a decline in user activity this month.
- Demand for its DOT coin also remains low.
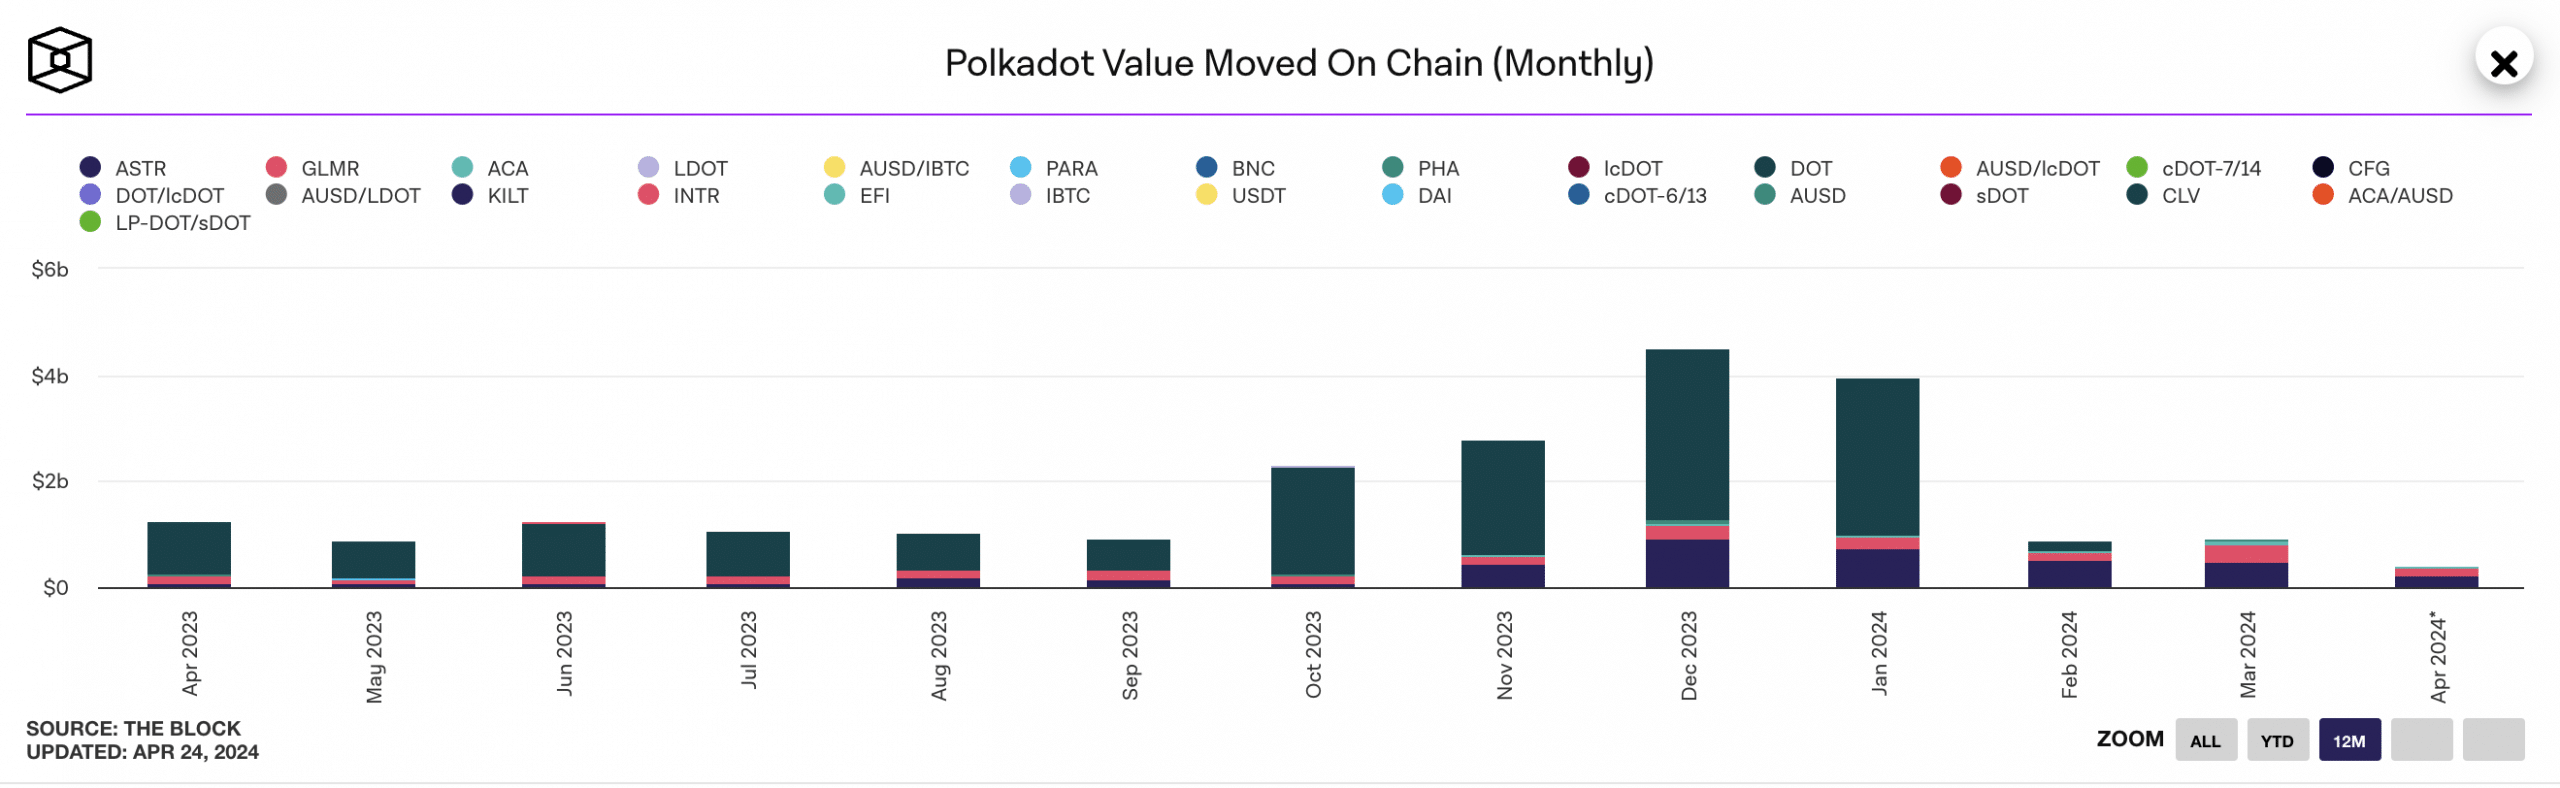
Monthly transaction volume on Polkadot’s [DOT] Relay Chain and parachains is poised to close April at its lowest level year-to-date (YTD), data from The Block has shown.
Source: CryptoQuant
The Relay Chain is the central chain of the Polkadot network that handles the coordination and security of the blockchain. Its parachains refer to the individual blockchains that run parallel and are connected to the Relay Chain.
So far this month, the network’s transaction volume has totaled $400 million, representing a 56% decline from the $916 million recorded in March. Polkadot’s monthly transaction volume has dropped by 90% from the $4 billion it registered at the end of January.
Polkadot witnesses user drought
The decline in the economic throughput across Polkadot Relay Chain and its parachains is due to the low user activity on the network in April.
According to data from The Block, the past 25 days have been marked by a 43% drop in the number of unique addresses active on the network’s Relay Chain as senders or receivers.
Likewise, new user demand for the Polkadot Relay Chain has plummeted.
So far this month, the number of unique addresses appearing for the first time on the network has totaled 44,000. This represents a 60% fall from the 112,000 new demand for the Layer-0 blockchain in March.
Across its several parachains, the month has seen a corresponding decline in user activity. According to The Block’s data, the count of monthly active addresses closed March at a YTD high of 6 million.
However, April has seen a reduction in network activity across Polkadot’s parachains, with only 2.2 million active addresses recorded in the past 25 days.
Further, new demand for these parachains has dropped. In the past 25 days, only 101,000 new addresses have used these networks. In March, they recorded 1.52 million new addresses.
Look before you leap
Although readings from DOT’s Moving average convergence/divergence (MACD) showed a resurgence in bullish sentiments, it is key to note that demand for the altcoin remains low.
Read Polkadot’s [DOT] Price Prediction 2024-25
As of this writing, the coin’s key momentum indicators rested below their respective center lines, suggesting that market participants favored sell-offs over accumulation.
Its Relative Strength Index (RSI) was 38.72, while its Money Flow Index (MFI) was 37.20.
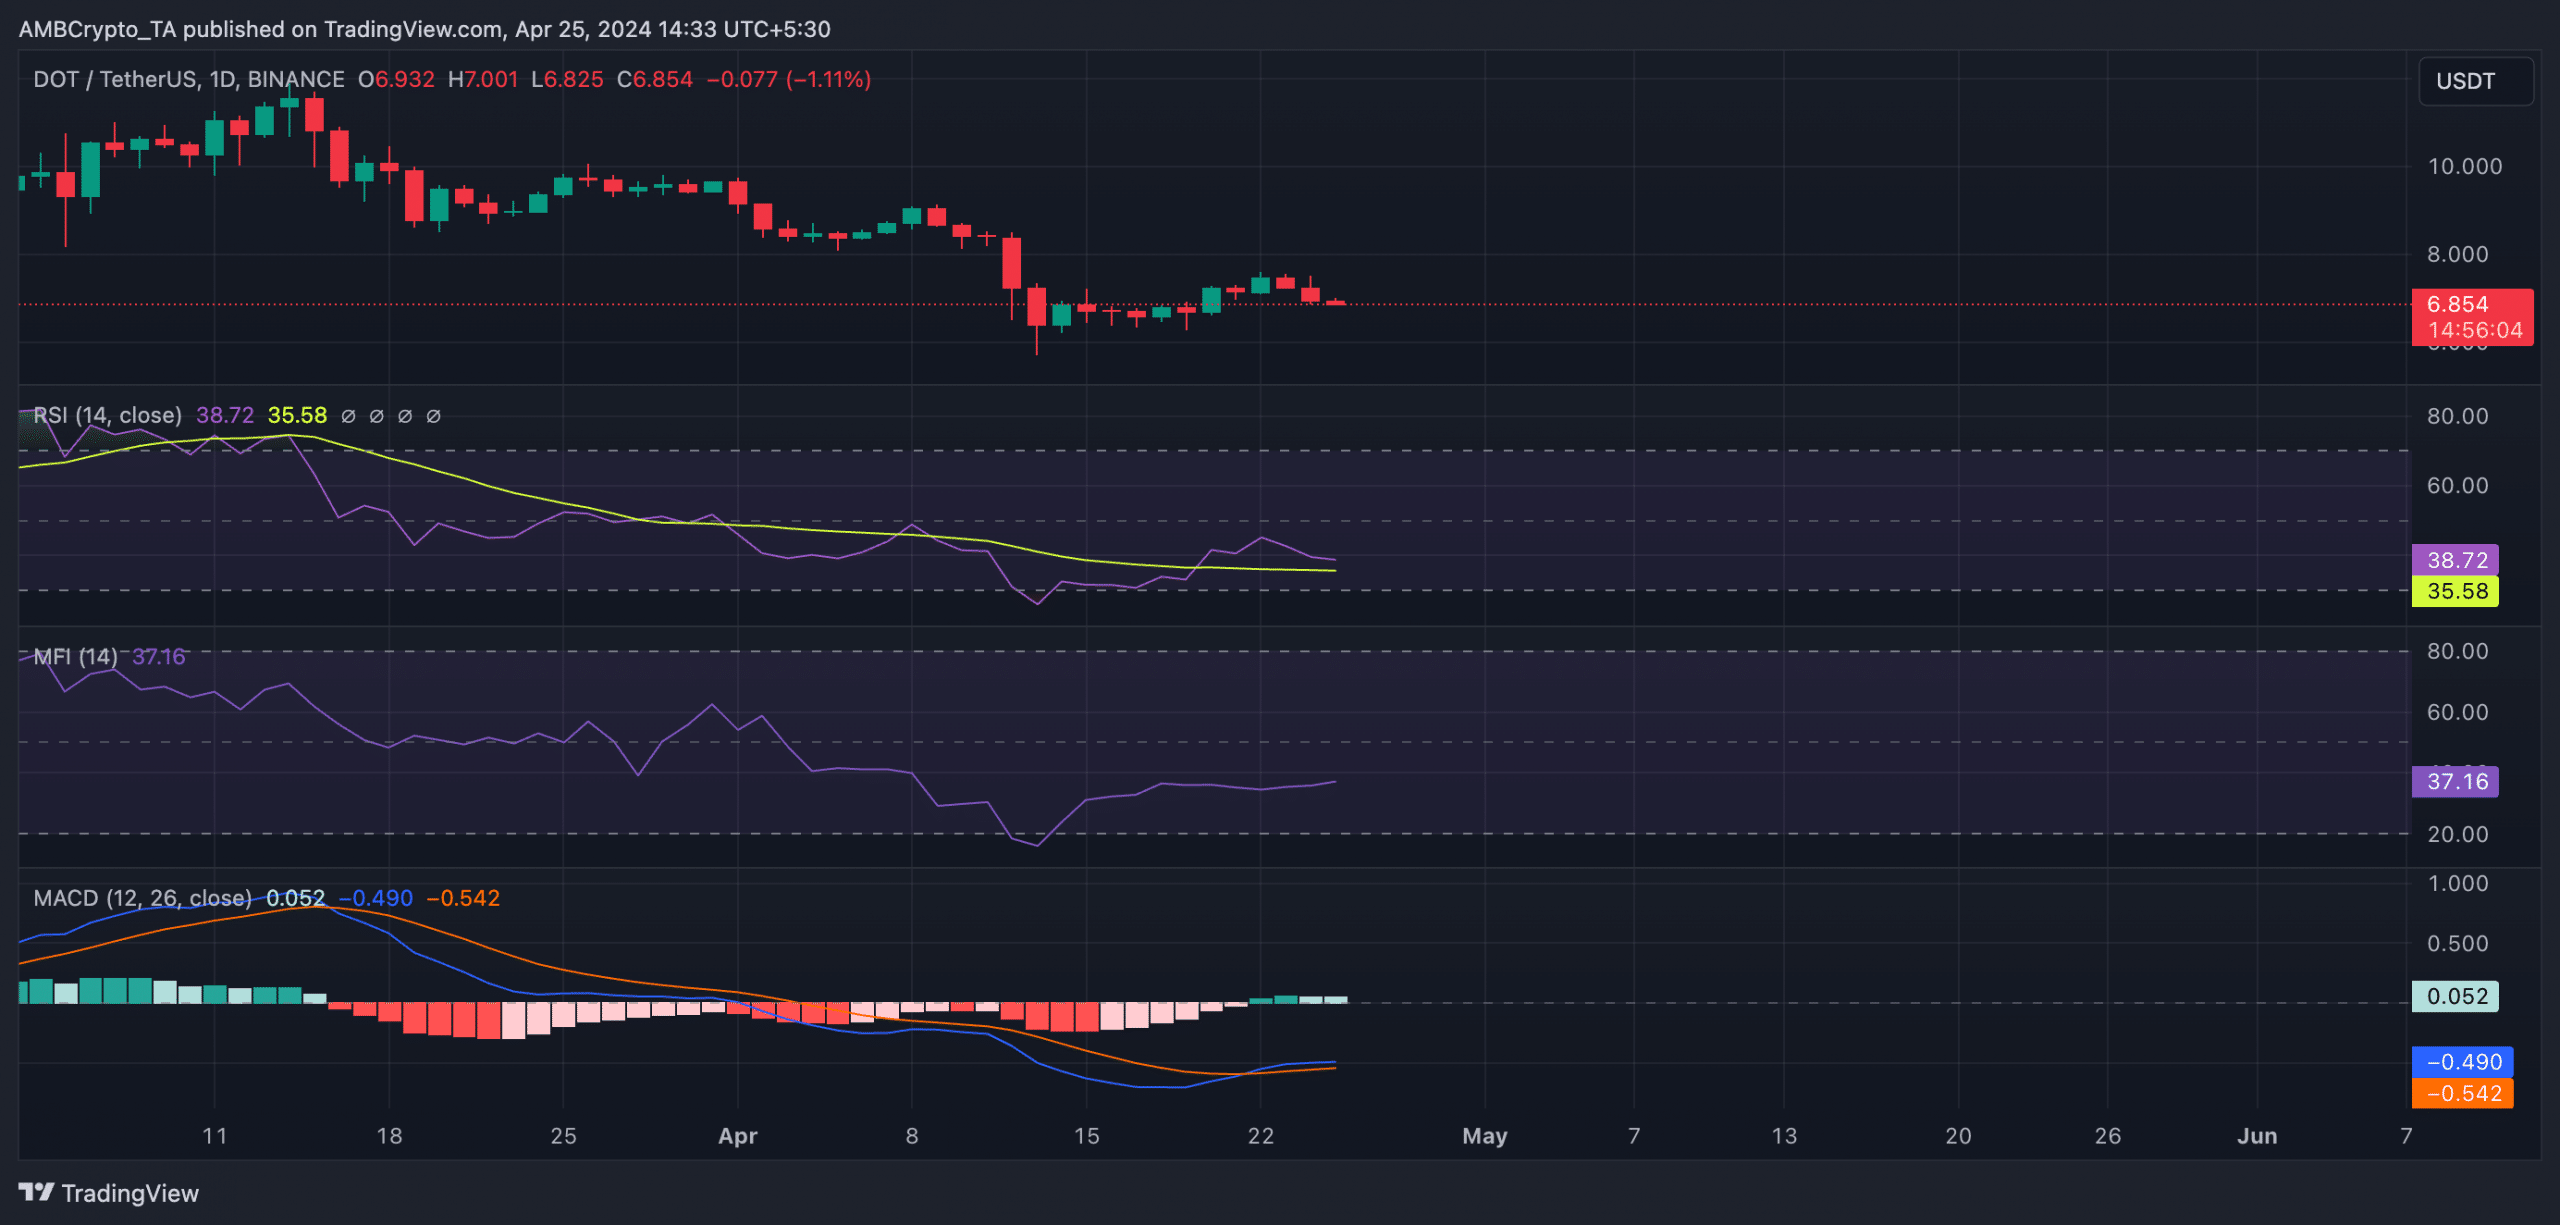
Source: DOT/USDT on TradingView