
- Bitcoin’s MVRV ratio nears a critical breakout as leverage across futures markets surges rapidly.
- A decisive move above $95,783 could unlock rapid upside, but heavy liquidations still threaten.
Bitcoin’s [BTC] MVRV ratio recently hovered at 2.13, sitting just below its critical 365-day Simple Moving Average (SMA365) of 2.14 — a historically decisive pivot for mid-term bullish reversals.
However, despite this promising setup, Bitcoin must achieve a confirmed weekly close above the SMA365 to validate the potential trend shift.
Therefore, market participants are closely monitoring this crossover, knowing it could mark the beginning of a stronger recovery phase.
Additionally, failure to reclaim this level could expose Bitcoin to renewed selling pressure, undermining the current momentum.
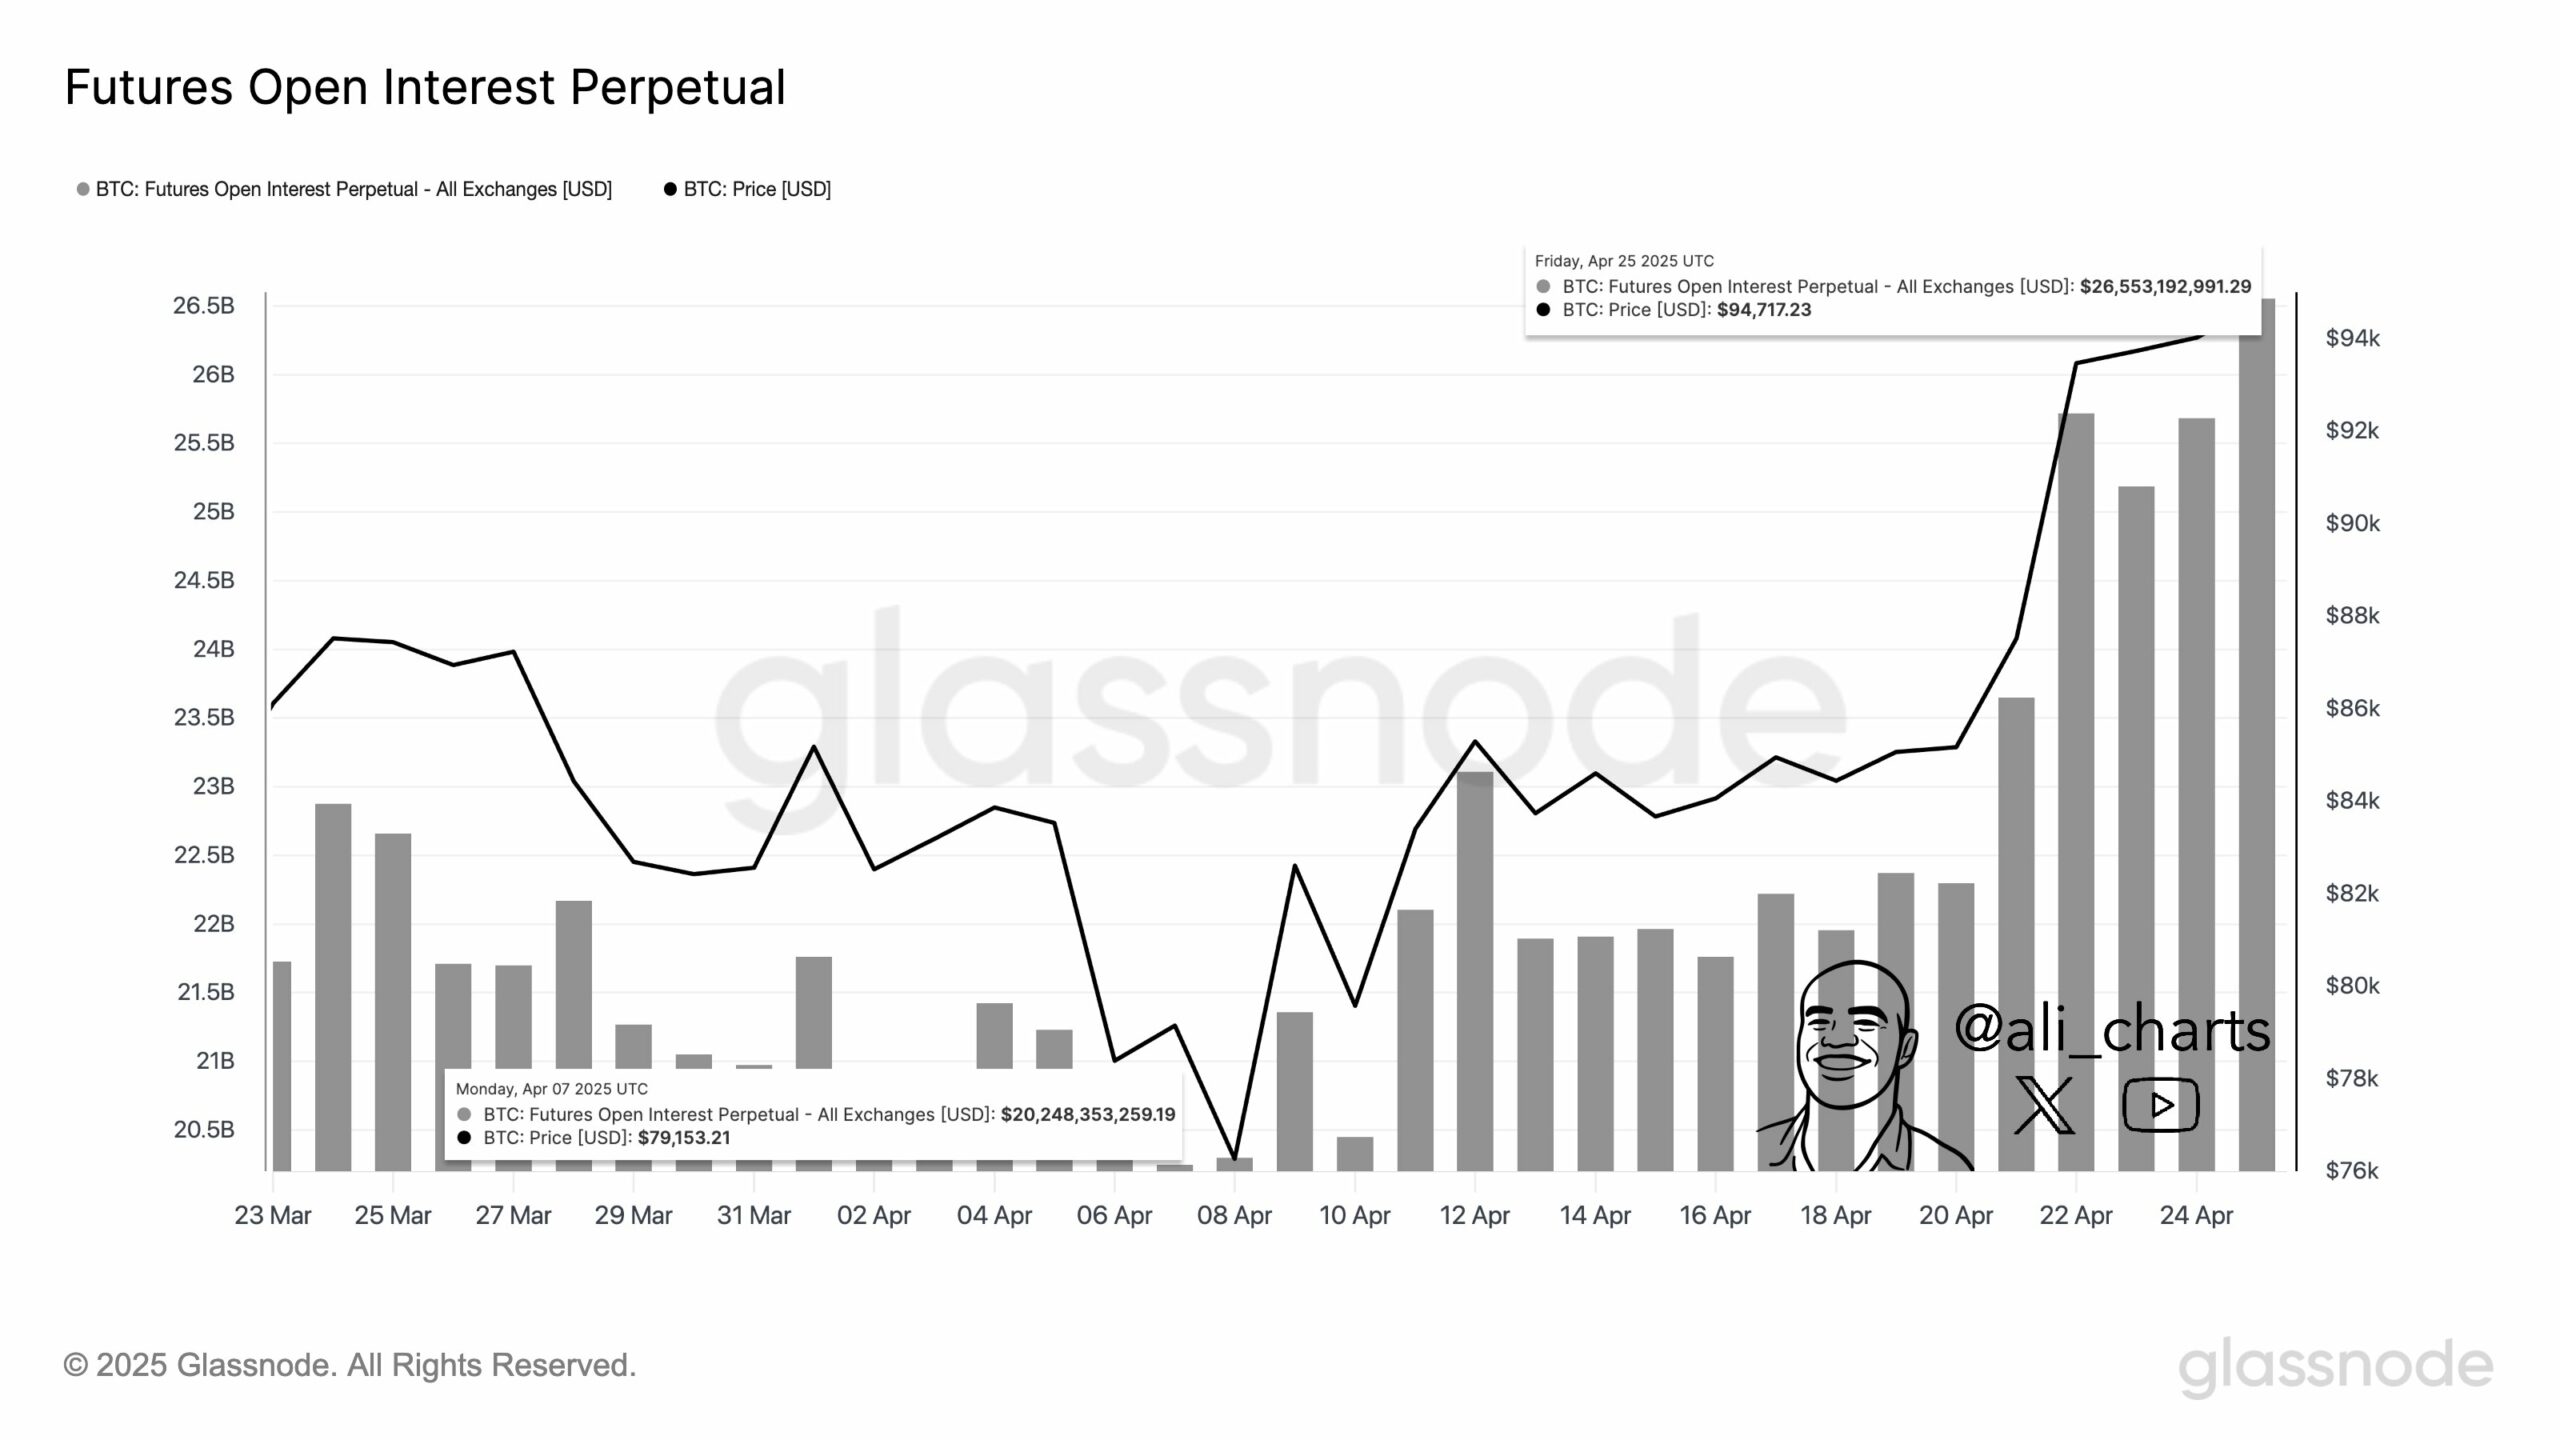
Bitcoin – Is speculation spiraling higher?
Open Interest across Bitcoin Futures markets surged by 20% in the past 20 days, now exceeding $26 billion, signaling an aggressive buildup in speculative positioning.
Furthermore, the Estimated Leverage Ratio has risen by 0.99%, showing that traders are increasingly relying on margin to amplify their bets.
However, while rising leverage often fuels stronger short-term price moves, it simultaneously increases the probability of volatile liquidation cascades if sentiment abruptly shifts.
Source: X
BTC technical price structure – Is the breakout losing steam?
Bitcoin recently broke out of a falling wedge formation, typically a bullish technical signal, suggesting the potential for sustained upside.
However, at press time, Bitcoin traded at $94,036, slipping 0.71% over 24 hours.
This minor pullback highlights that sellers are still defending the $95,783 resistance zone aggressively. Therefore, Bitcoin needs a clean daily close above this level to validate the bullish setup and aim for further gains.
Conversely, failure to breach this resistance could see the price slide back toward the $83,462 support level, where buyers previously showed strong interest.

Source: TradingView
Stock-to-Flow ratio decline – Is the scarcity model under pressure?
Bitcoin’s Stock-to-Flow (S2F) ratio, measuring scarcity, declined 22.22%, adding short-term pressure to the traditional bullish model.
However, the decline does not entirely undermine Bitcoin’s long-term fundamentals.
Instead, it emphasizes that immediate price movements are now more sensitive to liquidity trends, leverage dynamics, and investor sentiment shifts.

Source: CryptoQuant
Liquidation map analysis – Where could BTC move next?
The liquidation map shows dense, long liquidation clusters for Bitcoin between $93,000 and $94,000, creating a critical support zone.
A sustained dip below these levels could trigger a cascade of liquidations, potentially driving the price down to $91,000.
Conversely, if Bitcoin breaks and holds above $95,783, the liquidation density thins significantly, paving the way for a rapid upward move with minimal resistance.
This reduced overhead liquidation pressure strengthens the bullish outlook, provided momentum picks up again.

Source: CoinGlass
Conclusively, Bitcoin stood at a critical decision point.
The rising leverage, MVRV ratio positioning, and wedge breakout all suggest a bullish continuation if $95,783 resistance is flipped into support.
Therefore, if Bitcoin maintains strength and clears this level, the rally could extend aggressively. However, failure to do so will likely expose Bitcoin to sharp corrections toward lower liquidity zones.