- Traders are overleveraged at $96,957 on the lower side and $99,813 on the upper side.
- Bitcoin will once again cross the $100,000 mark if it closes a daily candle above the $99,700 level.
The cryptocurrency market faced a setback after Bitcoin [BTC], the world’s largest digital asset, experienced a significant 5.47% price decline in just one minute, following its historic crossing of the $100,000 mark for the first time.
This notable price decline has shifted overall market sentiment as traders have liquidated nearly a billion worth of long and short positions.
Why is BTC falling?
The potential for this significant price decline is yet to be known. However, data from the on-chain analytics firm Coinglass reported that a significant inflow into the exchanges might be responsible for this price decline.

Source: Coinglass
BTC spot inflow/outflow metrics reported that exchanges have witnessed a significant $732.5 million of BTC outflow. In the cryptocurrency context, “outflow” refers to the movement of assets from wallets to exchanges, often seen as a sign of selling pressure and a potential price decline.
However, the recent price decline has created fear among traders and investors and has further raised concern about whether the price will drop further or if the market will rebound.
Bitcoin technical analysis and key levels
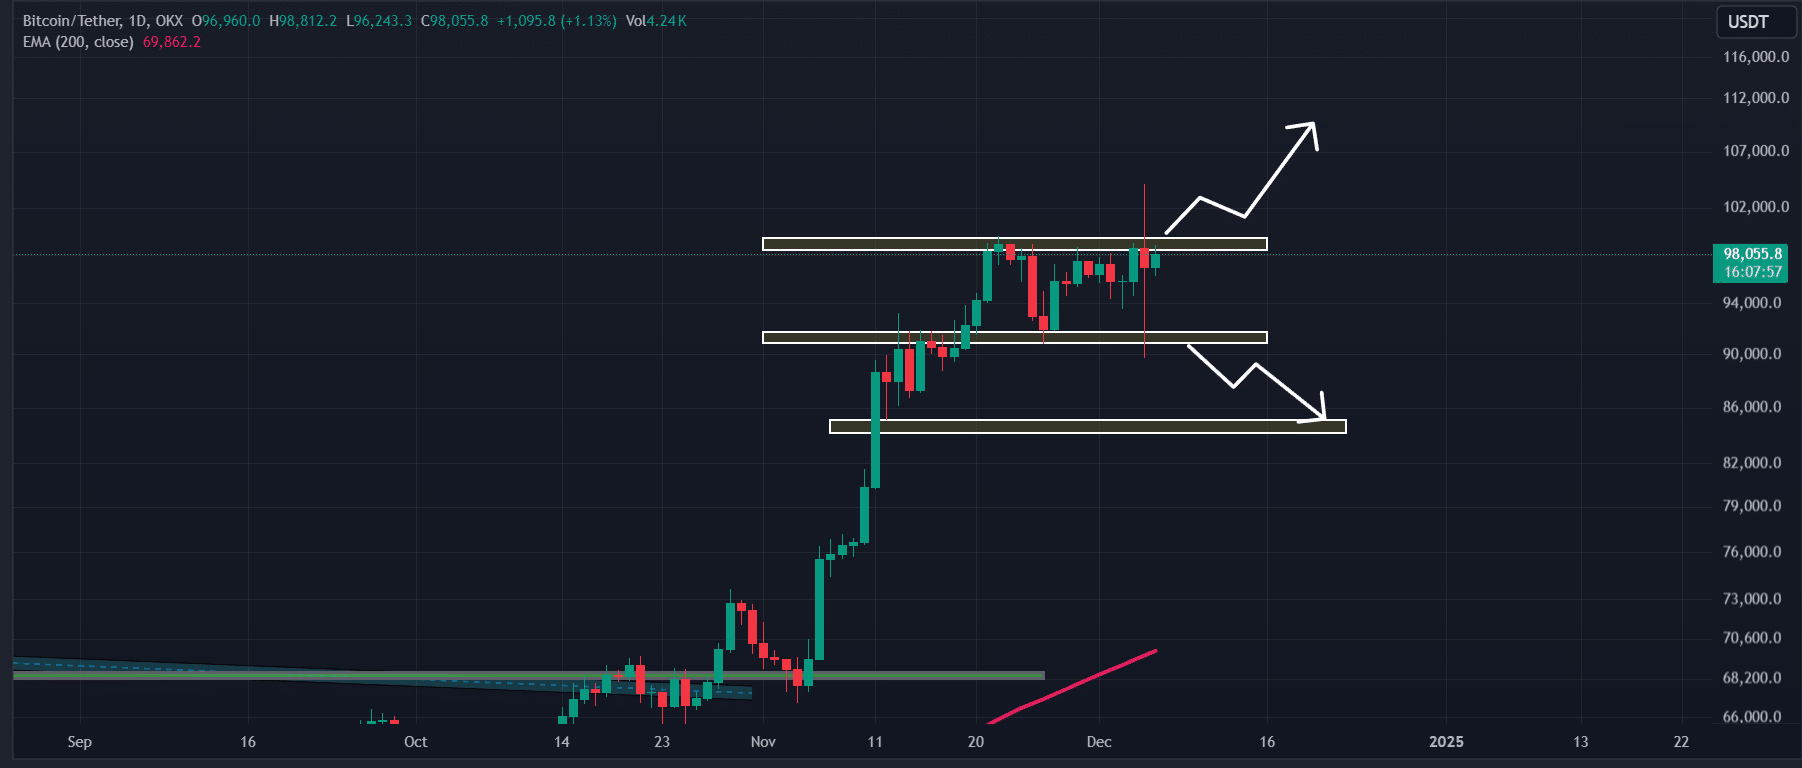
According to AMBCrypto’s technical analysis, BTC is consolidating in a tight range between $92,000 and $99,100. However, a recent breakout from this zone seems to have been a bull trap, as BTC failed to sustain its position above the range and has fallen back within it.


Source: TradingView
Based on recent price action, if BTC breaks out above the upper boundary of the range and closes a daily candle above the $99,700 level, there is a strong possibility it will once again cross the $100,000 mark and sustain its position.
Conversely, if BTC breaks below the range and closes a daily candle under the $91,500 level, there is a strong likelihood it could drop to the $86,000 level.
Meanwhile, BTC’s Relative Strength Index (RSI) currently stands at 62, just below the overbought territory, indicating that the asset still has room to rise in the coming days.
Major liquidation levels
In addition to technical analysis, the major liquidation levels currently stand at $96,957 on the lower side and $99,813 on the upper side, with traders overleveraged at these points, according to Coinglass.


Source: Coinglass
If sentiment shifts towards bullish momentum and the price rises to the $99,813 level, nearly $938 million worth of short positions could be liquidated.
Conversely, if sentiment turns bearish and the price drops to $96,957, approximately $364 million worth of long positions could be liquidated.
Read Bitcoin’s [BTC] Price Prediction 2024-25
This liquidation data indicates that bearish sentiment is strongly dominating the asset, as many believe the BTC price will not surpass the $99,813 level.
At press time, BTC was trading near $97,970 and has registered a price decline of 4.10% in the past 24 hours. During the same period, its trading volume increased by 4%, indicating a modest rise in investor and trader participation compared to the previous day.

