
- TRX’s price surged by more than 10% in the last 24 hours.
- Selling pressure might increase, which can halt TRX’s bull rally.
While top coins like Bitcoin [BTC] face price correction, Tron [TRX] decoupled from the market. This was the case as the token’s price surged in double digits over the last 24 hours. Let’s have a look at TRX’s on-chain data to find out whether this trend will continue.
Bulls shift gears
Tron bulls have been playing their top game in the last seven days as the token’s price surged by 22%. In fact, in the last 24 hours alone, TRX’s price increased by more than 11%.
At the time of writing, TRX was trading at $0.16 with a market capitalization of over $13.8 billion, making it the 10th largest crypto. Thanks to this price increase, TRX’s price reached a yearly high.
A major reason behind this bull rally was a memecoin project launch on Tron. AMBCrypto reported the launch of SunPump.
According to Lookonchain, the Tron Network has made over 1.84 million TRX, or almost $246k, since launching SunPump in just a few days.
The price rise also had a positive impact on the token’s social metrics. AMBCrypto’s analysis of Santiment’s data revealed that TRX’s weighted sentiment increased sharply.
This indicated that bullish sentiment around the token was dominant in the market. Additionally, its social volume also surged, reflecting an increase in the token’s popularity in the crypto space.
Source: Santiment
TRX has a problem though
While this price increase looked optimistic, Tron has a few obstacles ahead. AMBCrypto’s look at IntoTheBlock’s data revealed that 100% of TRX investors were in profit.
This suggested that investors might choose to sell their holdings in order to earn profits. If that happens, selling pressure would rise, in turn putting an end to TRX’s bull rally.

Source: IntoTheBlock
AMBCrypto’s analysis of Coinglass’ data pointed out yet another bearish metric. TRX’s long short ratio registered a decline. This indicated that there were more short positions in the market than long positions, which was bearish.

Source: Coinglass
The token’s Relative Strength Index (RSI) entered the overbought zone, hinting at a possible rise in selling pressure. As per the Bollinger Bands, TRX’s price had touched the upper limit of the indicator, which often results in price corrections.
Nonetheless, the Chaikin Money Flow (CMF) registered an uptick, suggesting a continued price rise.
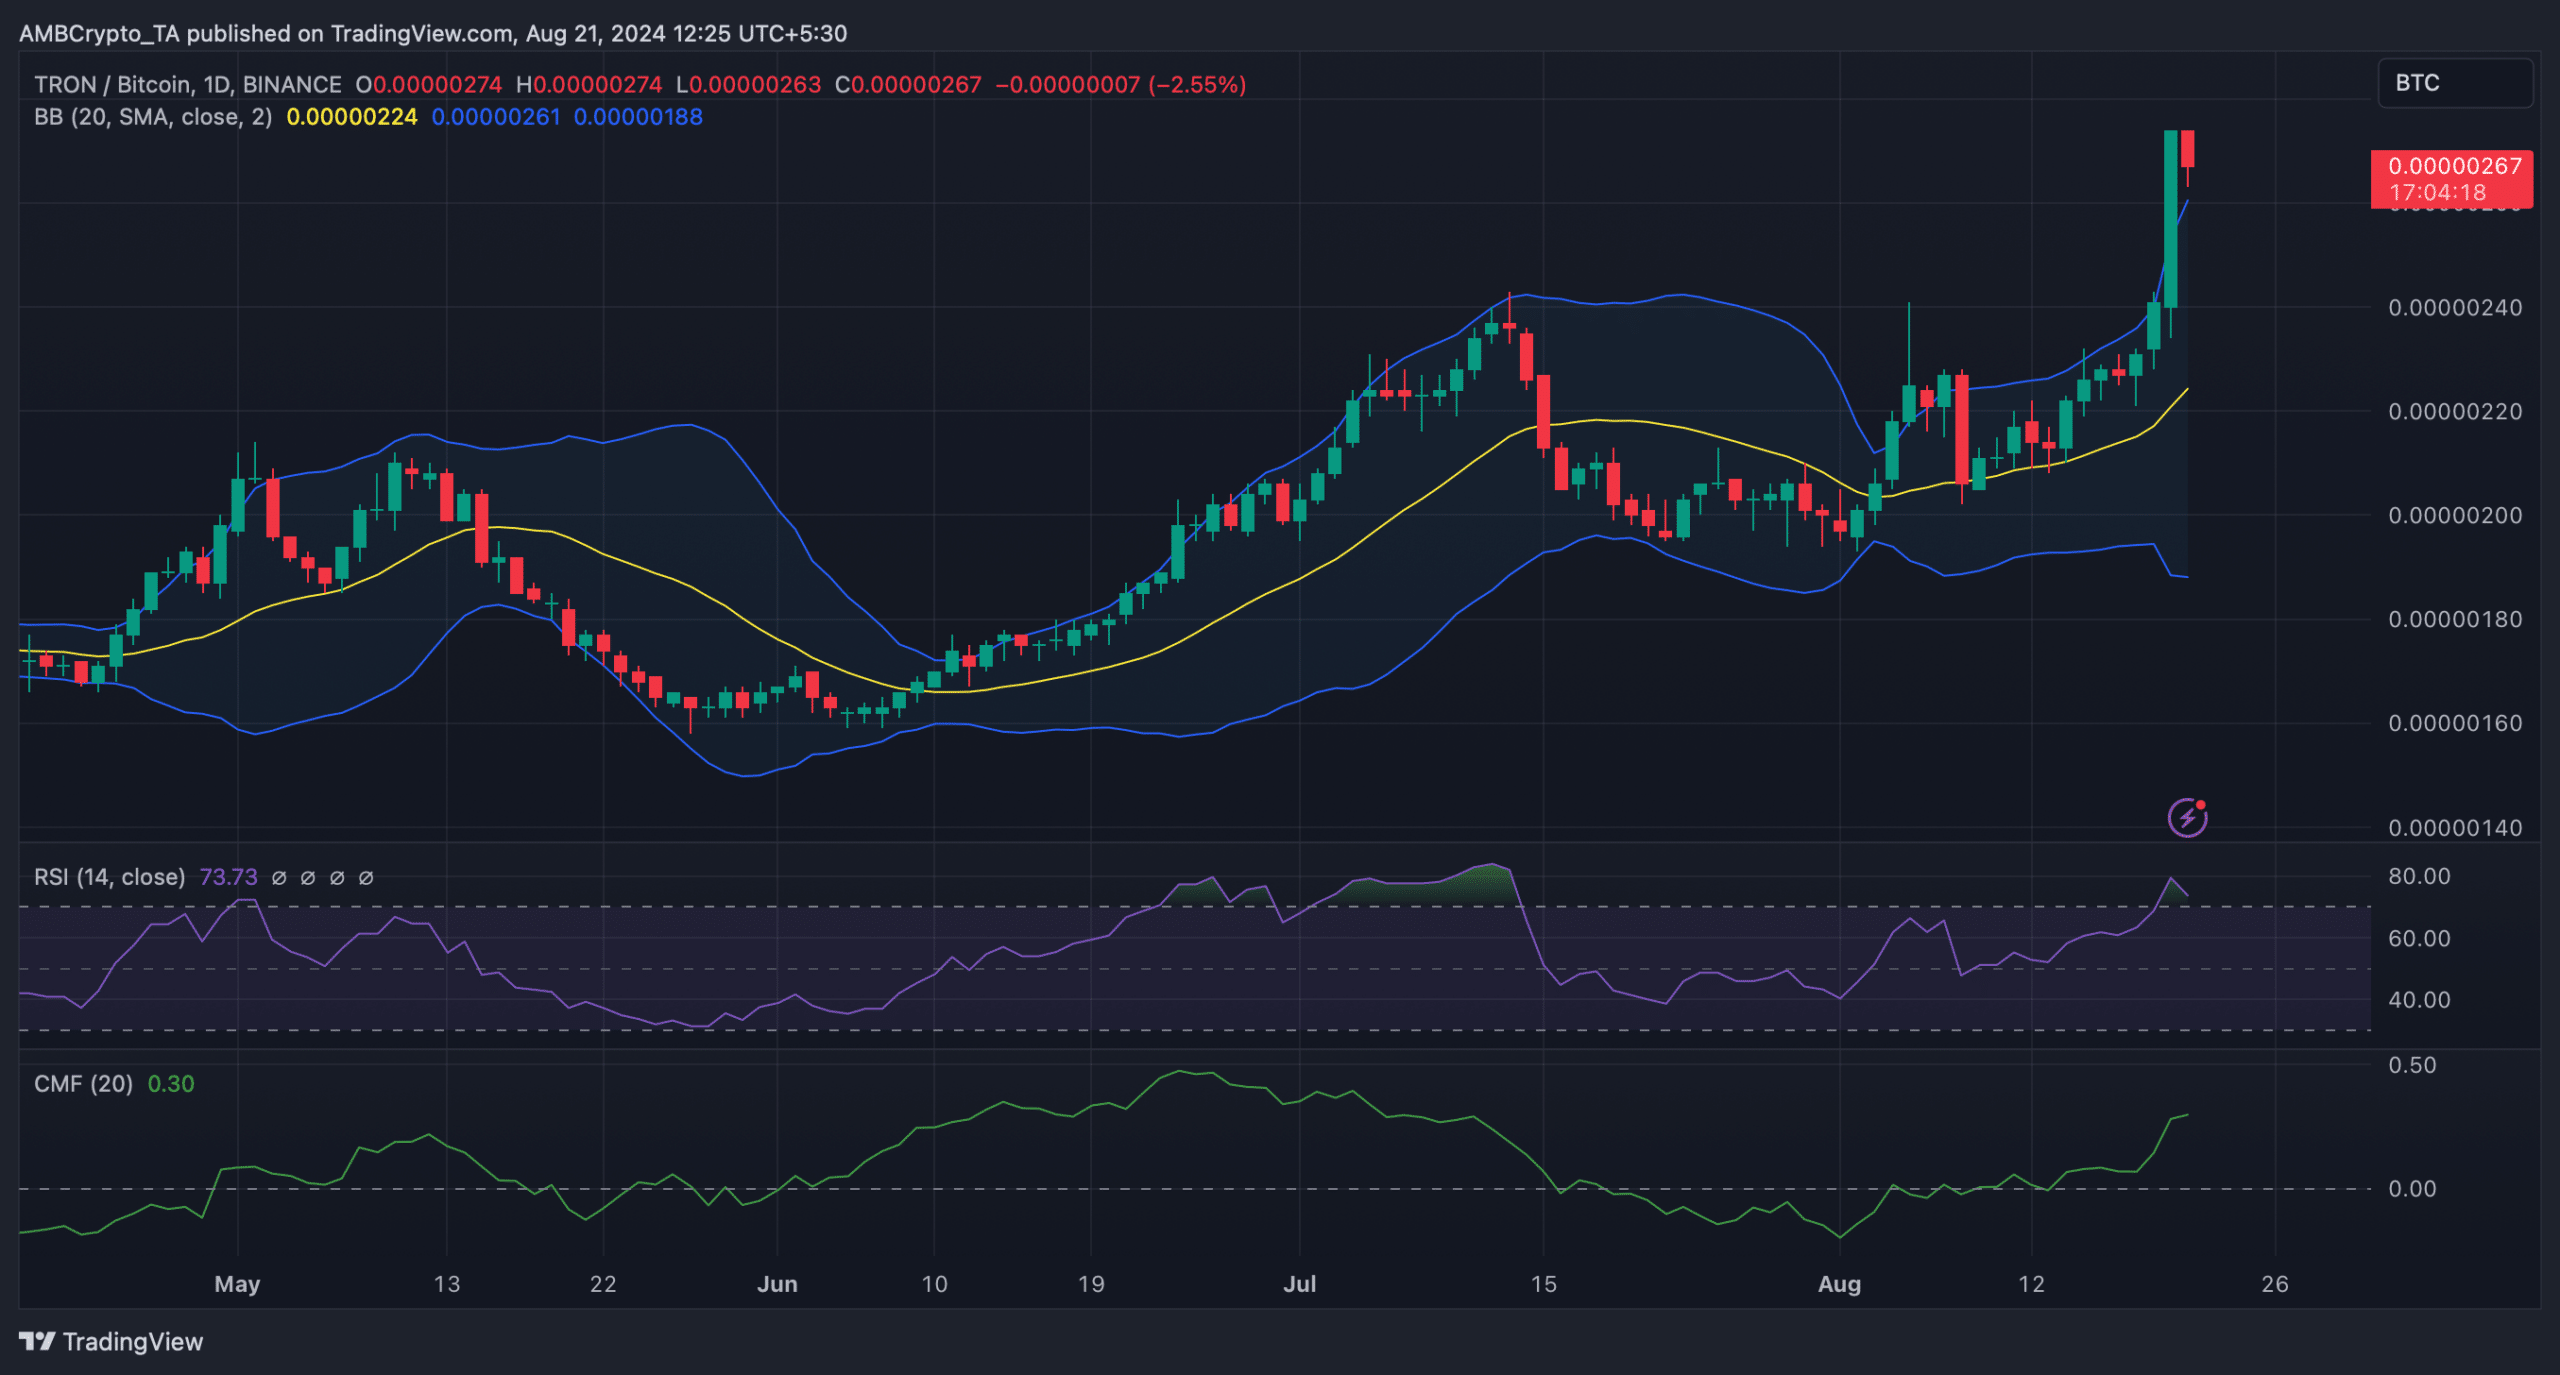
Source: TradingView
Realistic or not, here’s TRX market cap in BTC’s terms
If the bull rally continues, then it won’t be surprising to see Tron touching $0.17 in the coming days. However, in the event of a bearish takeover, TRX might plummet to $0.13.

Source: Hyblock Capital