
- The SOL/ETH chart has seen a significant surge, implying that Solana is gaining more traction than ETH.
- This massive surge can be attributed to the recent growth in transactions and network usage.
Solana [SOL] and Ethereum [ETH] have had varying performances in the past month, with the assets taking different paths.
On the one hand, SOL has had a bullish run, with a positive outcome of 3.45% over the past month. For ETH, it’s a different scenario—it has dropped 14.37%, adding to the former’s dominance.
However, analysis shows there’s more to the recent gain in market dominance that Solana has had over Ethereum in the past day, and its impact on the assets’ price moving forward.
New record, high interest
In the last 24 hours, the SOL/ETH daily chart closed above $0.08043—marking its highest level since inception. Naturally, this milestone signals a fresh wave of capital rotation into Solana.
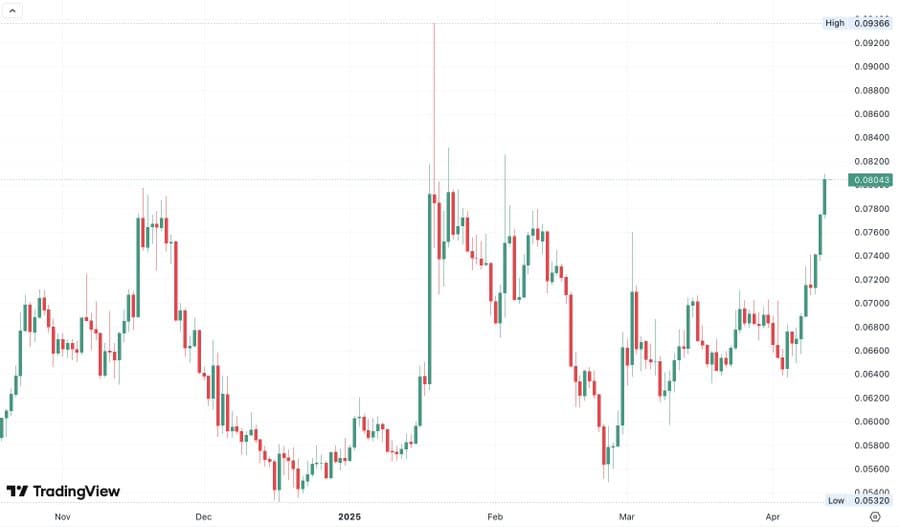
Source: TradingView
The implications are clear: Investors are allocating more funds into SOL relative to ETH.
This kind of move typically reflects expectations of stronger performance from Solana in the short to mid-term. Also, Artemis’ liquidity flow data aligns with this shift.
Over the past week, Solana posted a positive net inflow of $25.4 million—calculated by subtracting outflows from total inflows.
Ethereum, by contrast, saw a negative net flow of $8.8 million, indicating a pullback in investor confidence as liquidity exited the network.

Source: Artemis
More factors surrounding SOL’s dominance
Solana’s recent market share growth has been fueled by increased on-chain activity. Daily Active Addresses recently reached 6.2 million, marking the highest level since February.
This surge highlights a rising interest in the market. With sentiment improving, more users are actively engaging with the network.
Naturally, this increased activity drives demand for SOL.
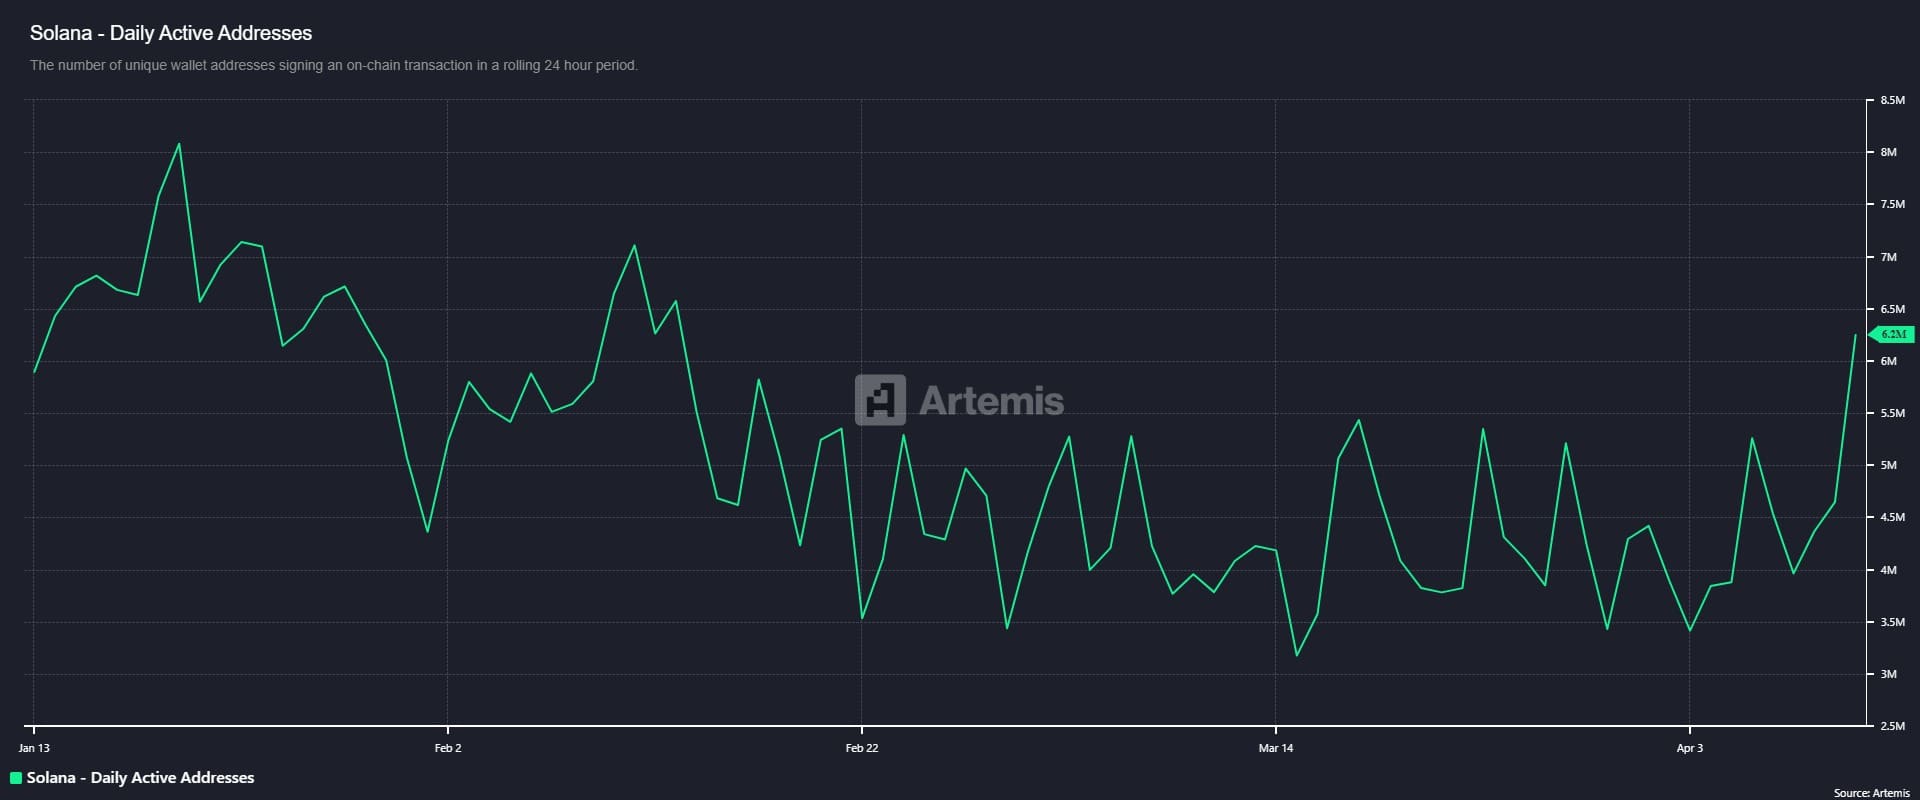
Source: Artemis
This has led to daily transactions conducted on Solana rising to a high of 96.1 million, up from a low of 69.5 million on the 1st of March, highlighting the strength the market is gaining and the growing level of usage.
In fact, the availability of stablecoins on Solana has reached $12.6 billion—again hitting a level it last saw in February.
When the supply of stablecoins grows, it implies there’s increasing demand for use on the network, adding to the potential growth for SOL and its value over time.
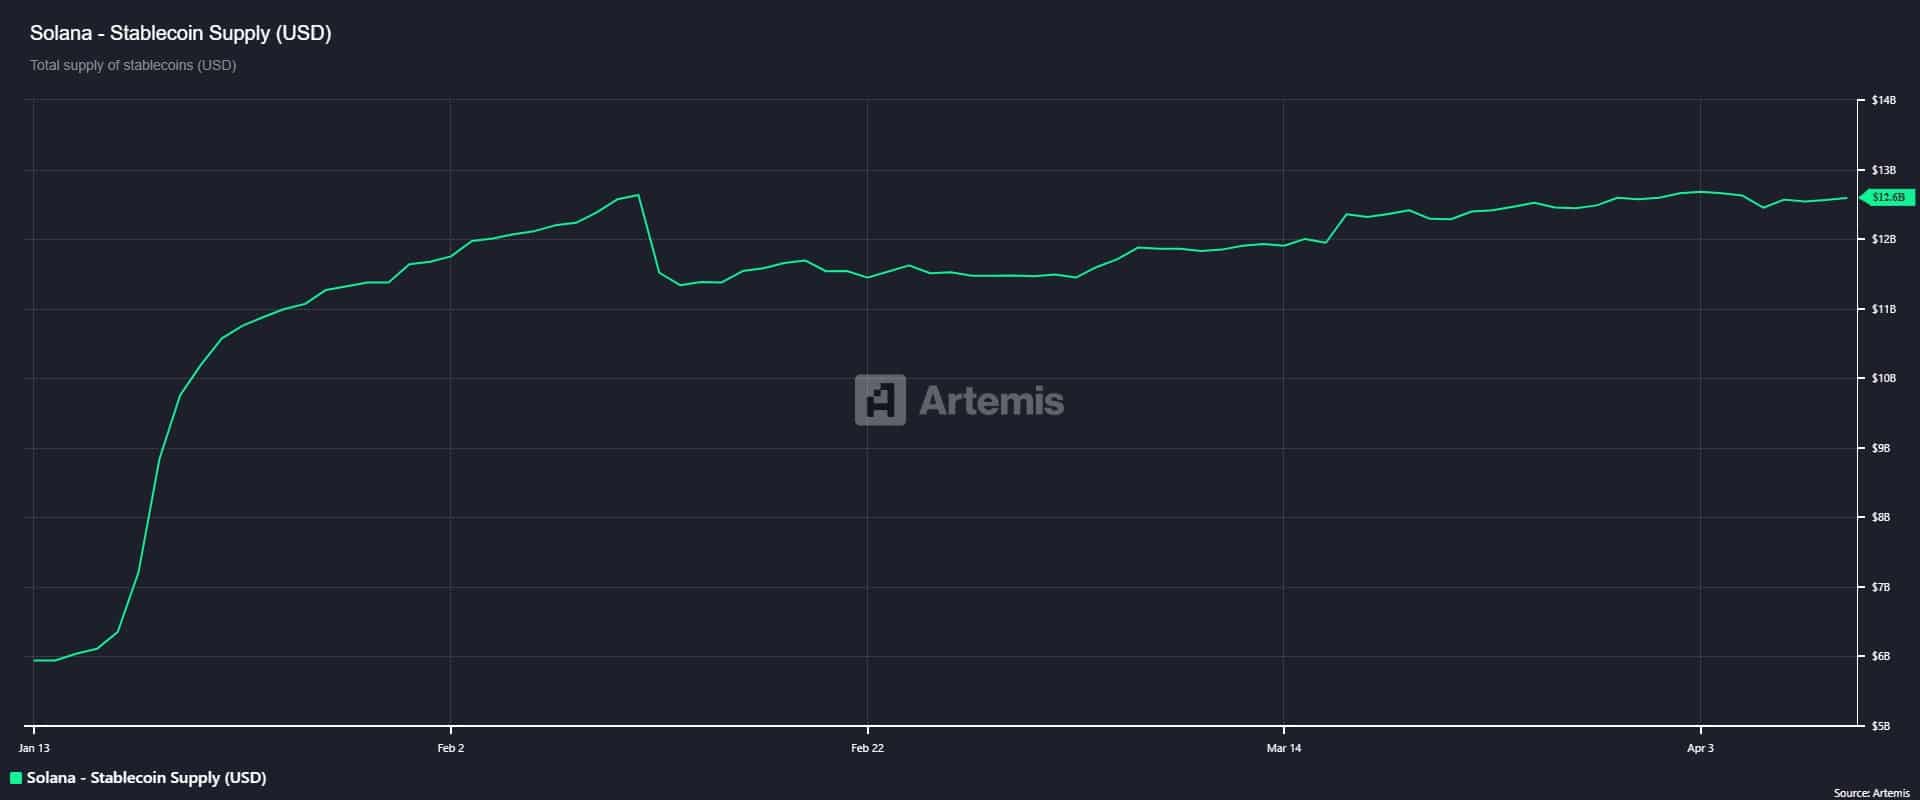
Source: Artemis
Market responds positively
The market response to Solana’s recent activity has been encouraging.
After two days of selling, during which $95.54 million exited the market, spot traders have resumed buying—a clear indicator of renewed interest.
Over the past 24 hours, spot traders purchased $9.28 million worth of assets, further boosting sentiment.
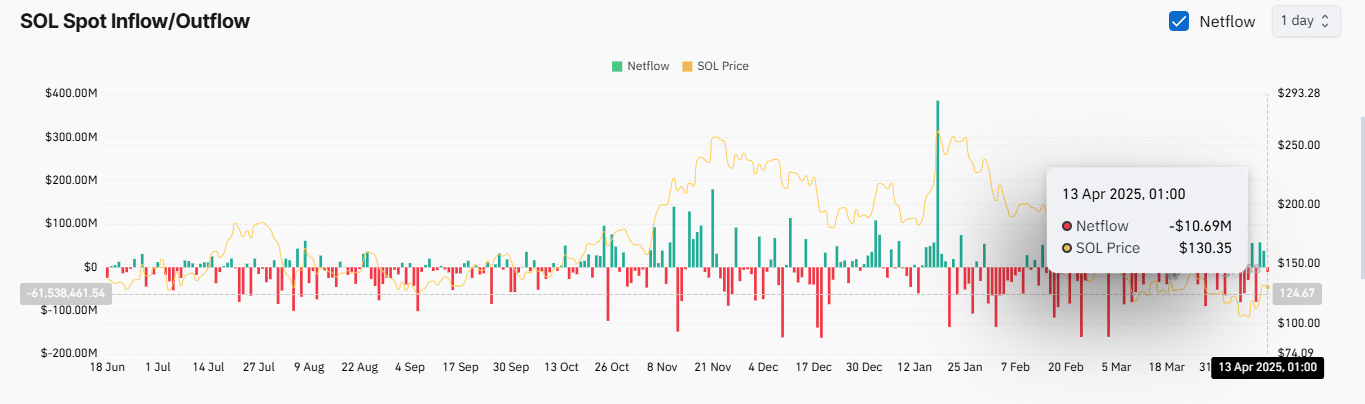
Source: CoinGlass
If on-chain activity continues to favor bulls in the market, along with continued spot trader accumulation, then SOL is primed for a further rally.