
- The cryptocurrency has hit resistance that is expected to weigh on its price and delay any significant upward movement.
- A short-term pullback seems inevitable.
Despite some lingering positive sentiment, Polkadot [DOT] has struggled to show any strong momentum across various timeframes. Following a 2.18% loss in daily trading, the downward pressure will likely persist.
This anticipated dip is driven by weakening buying pressure as traders’ sentiment softens. However, a bullish undertone remains, which signals the possibility of recovery once market conditions improve.
DOT charts short-term decline amid supply zone pressure
DOT is showing a short-term dip on the charts, despite trading within an overall ascending channel—a bullish pattern. The asset recently encountered a mid-range supply zone between $4.512 and $4.563, which has contributed to its current price decline.
This pressure caused DOT to break below its first support level at $4.258, which also aligns with the Fibonacci retracement level at the same point. The price is now approaching the next support level at $4.182, as indicated by Fibonacci levels.
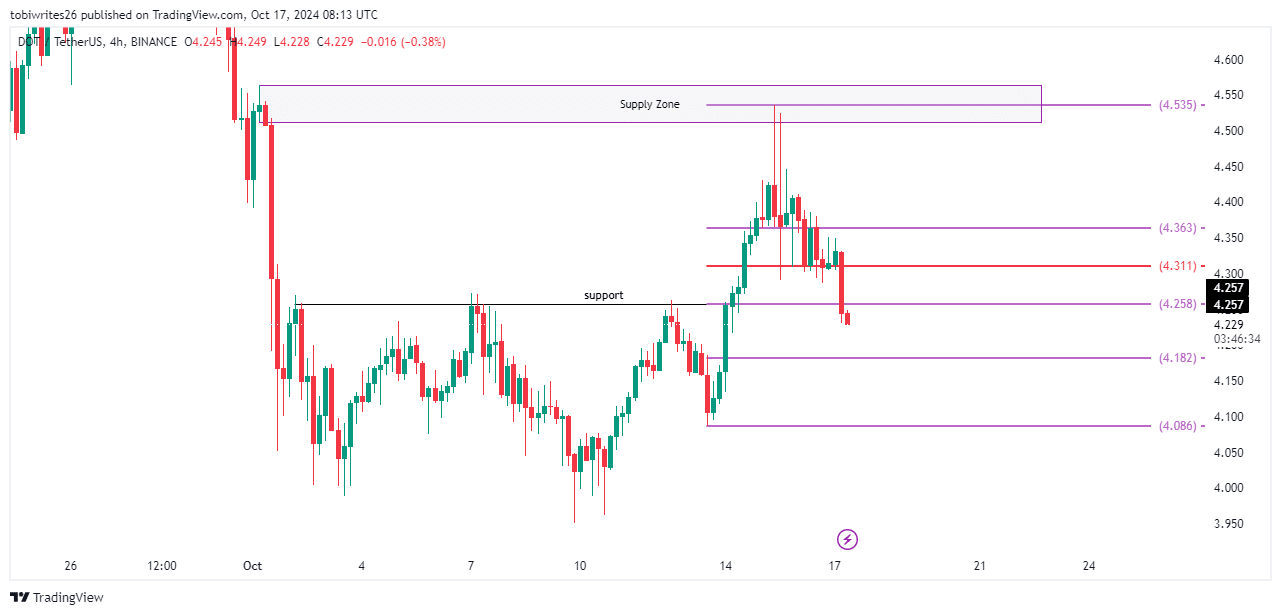
Source: Trading View
If selling pressure intensifies, DOT could plunge as low as $4.086 before finding balance and potentially resuming its upward trend.
The current selling pressure is likely to persist, as on-chain data suggests trader sentiment remains bearish on the asset.
Ripple effect on Polkadot as trader confidence fades
On-chain metrics indicate that trader confidence in DOT is fading, likely pushing the asset lower in the short term.
According to data from Coinglass, Open Interest (OI)—which tracks the number of unsettled derivative contracts, specifically futures trades—has seen a noticeable decline.
Recently, DOT’s OI dropped by 1.43%, bringing its value to $229.07 million. This suggests a rise in short contracts, with traders increasingly betting on further declines in DOT’s price.
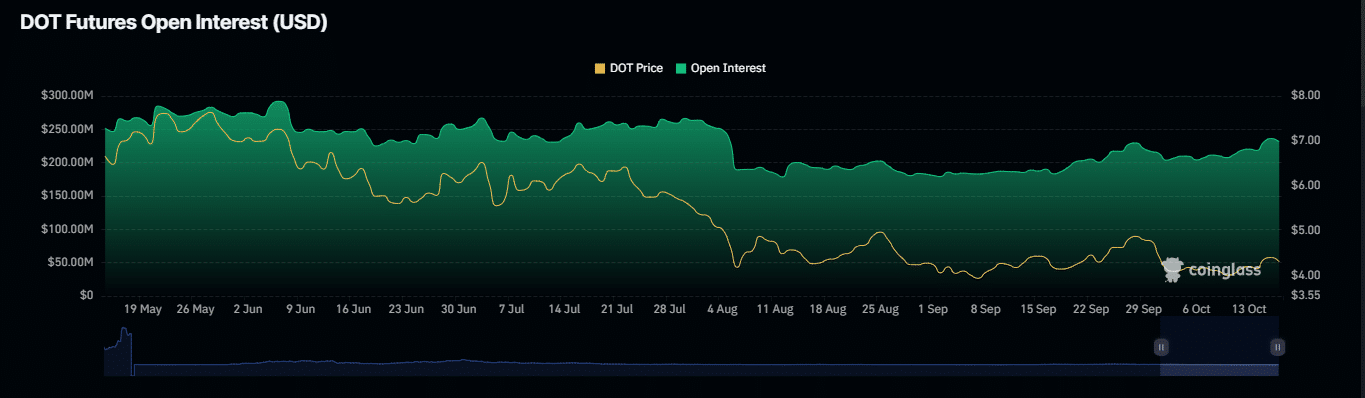
Source: Coinglass
Liquidation data supports this trend, showing an increase in losses for long traders who had previously been optimistic about a price increase but are now feeling the effects of growing bearish sentiment.
Of the $136.72 thousand in trader positions liquidated, long traders accounted for $123.21 thousand, as the market has shifted predominantly toward short positions.
Are bulls seeking more profitable entry points?
DOT remains in a bullish trend, trading within an ascending triangle—a pattern that signals potential upward movement. Interestingly, AMBCrypto has identified another bullish indicator, confirming continued signs of strength.
At the time of writing, data from Coinglass reveals that Exchange Netflow has been predominantly negative on both daily and weekly timeframes.
Negative netflow typically indicates that traders are withdrawing assets from exchanges, suggesting they intend to hold rather than sell, a bullish signal.
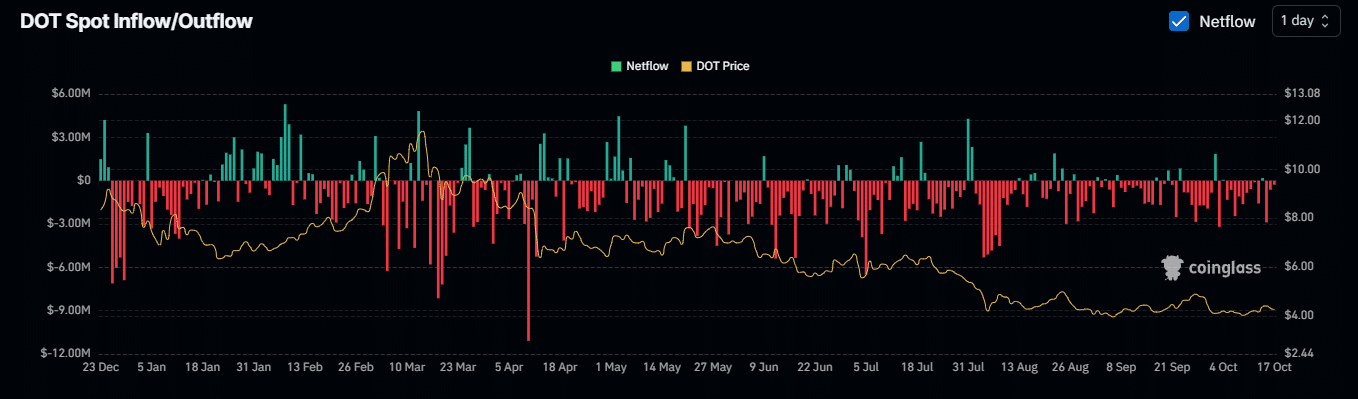
Source: Coinglass
Read Polkadot’s [DOT] Price Prediction 2024–2025
With $274.82 thousand and $3.59 million in Exchange Netflow recorded on the daily and weekly respectively, the overall market sentiment remains bullish.
The recent price dip may be attributed to bulls searching for an optimal entry point, preparing to accumulate DOT in bulk.