
- Large SHIB transaction volumes have dropped from 2.65 trillion to 1.84 trillion.
- SHIB’s netflow to exchanges reached 321 billion tokens, the highest level in over a week.
Shiba Inu [SHIB] traded at $0.00001879 at press time after a 3% gain in 24 hours. During this time, trading volumes plunged by 11%, showing weak demand for SHIB at its current price.
The weakening demand could be due to whale inactivity. A look at the large transaction volumes for SHIB in the last seven days showed that buying pressure from whales has waned.
In fact, large SHIB transaction volumes had dropped from 2.65 trillion to 1.84 trillion at press time.
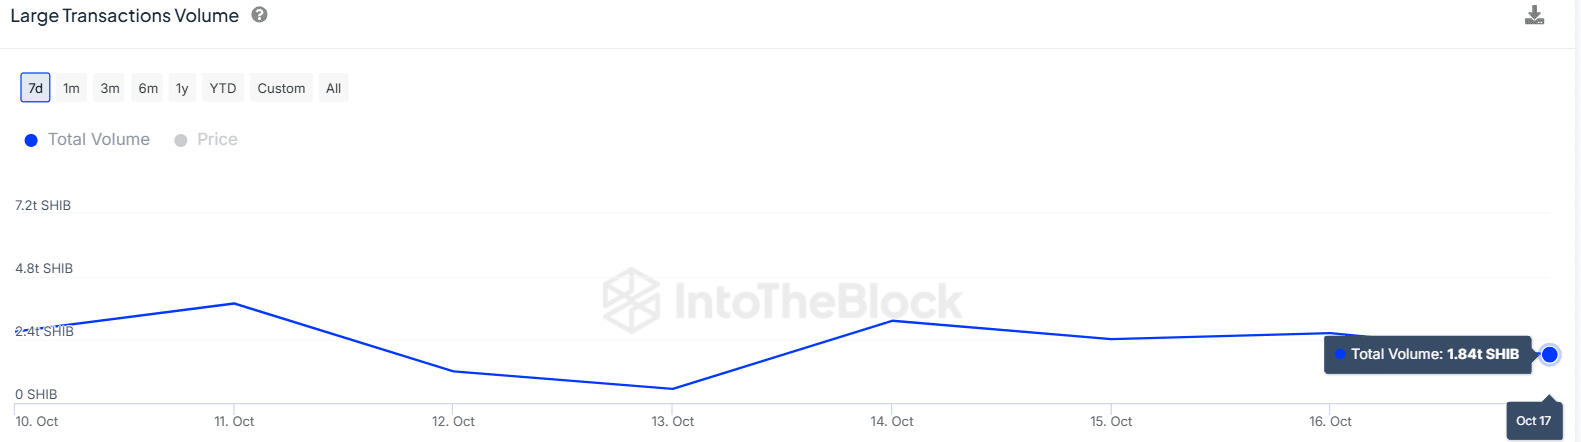
Source: IntoTheBlock
A spike in whale transactions was seen earlier this week after Bitcoin [BTC] price recovery fueled optimism across the crypto market.
However, the whale transactions have since subsided, with the drop suggesting that they could be waiting for an opportunity to either increase or reduce their holdings.
A look at exchange data shows that some SHIB holders might be getting ready to sell. Netflows to exchanges stood at 321 billion tokens at press time, the highest level in over a week. These inflows were a significant jump from the previous day’s negative flows.
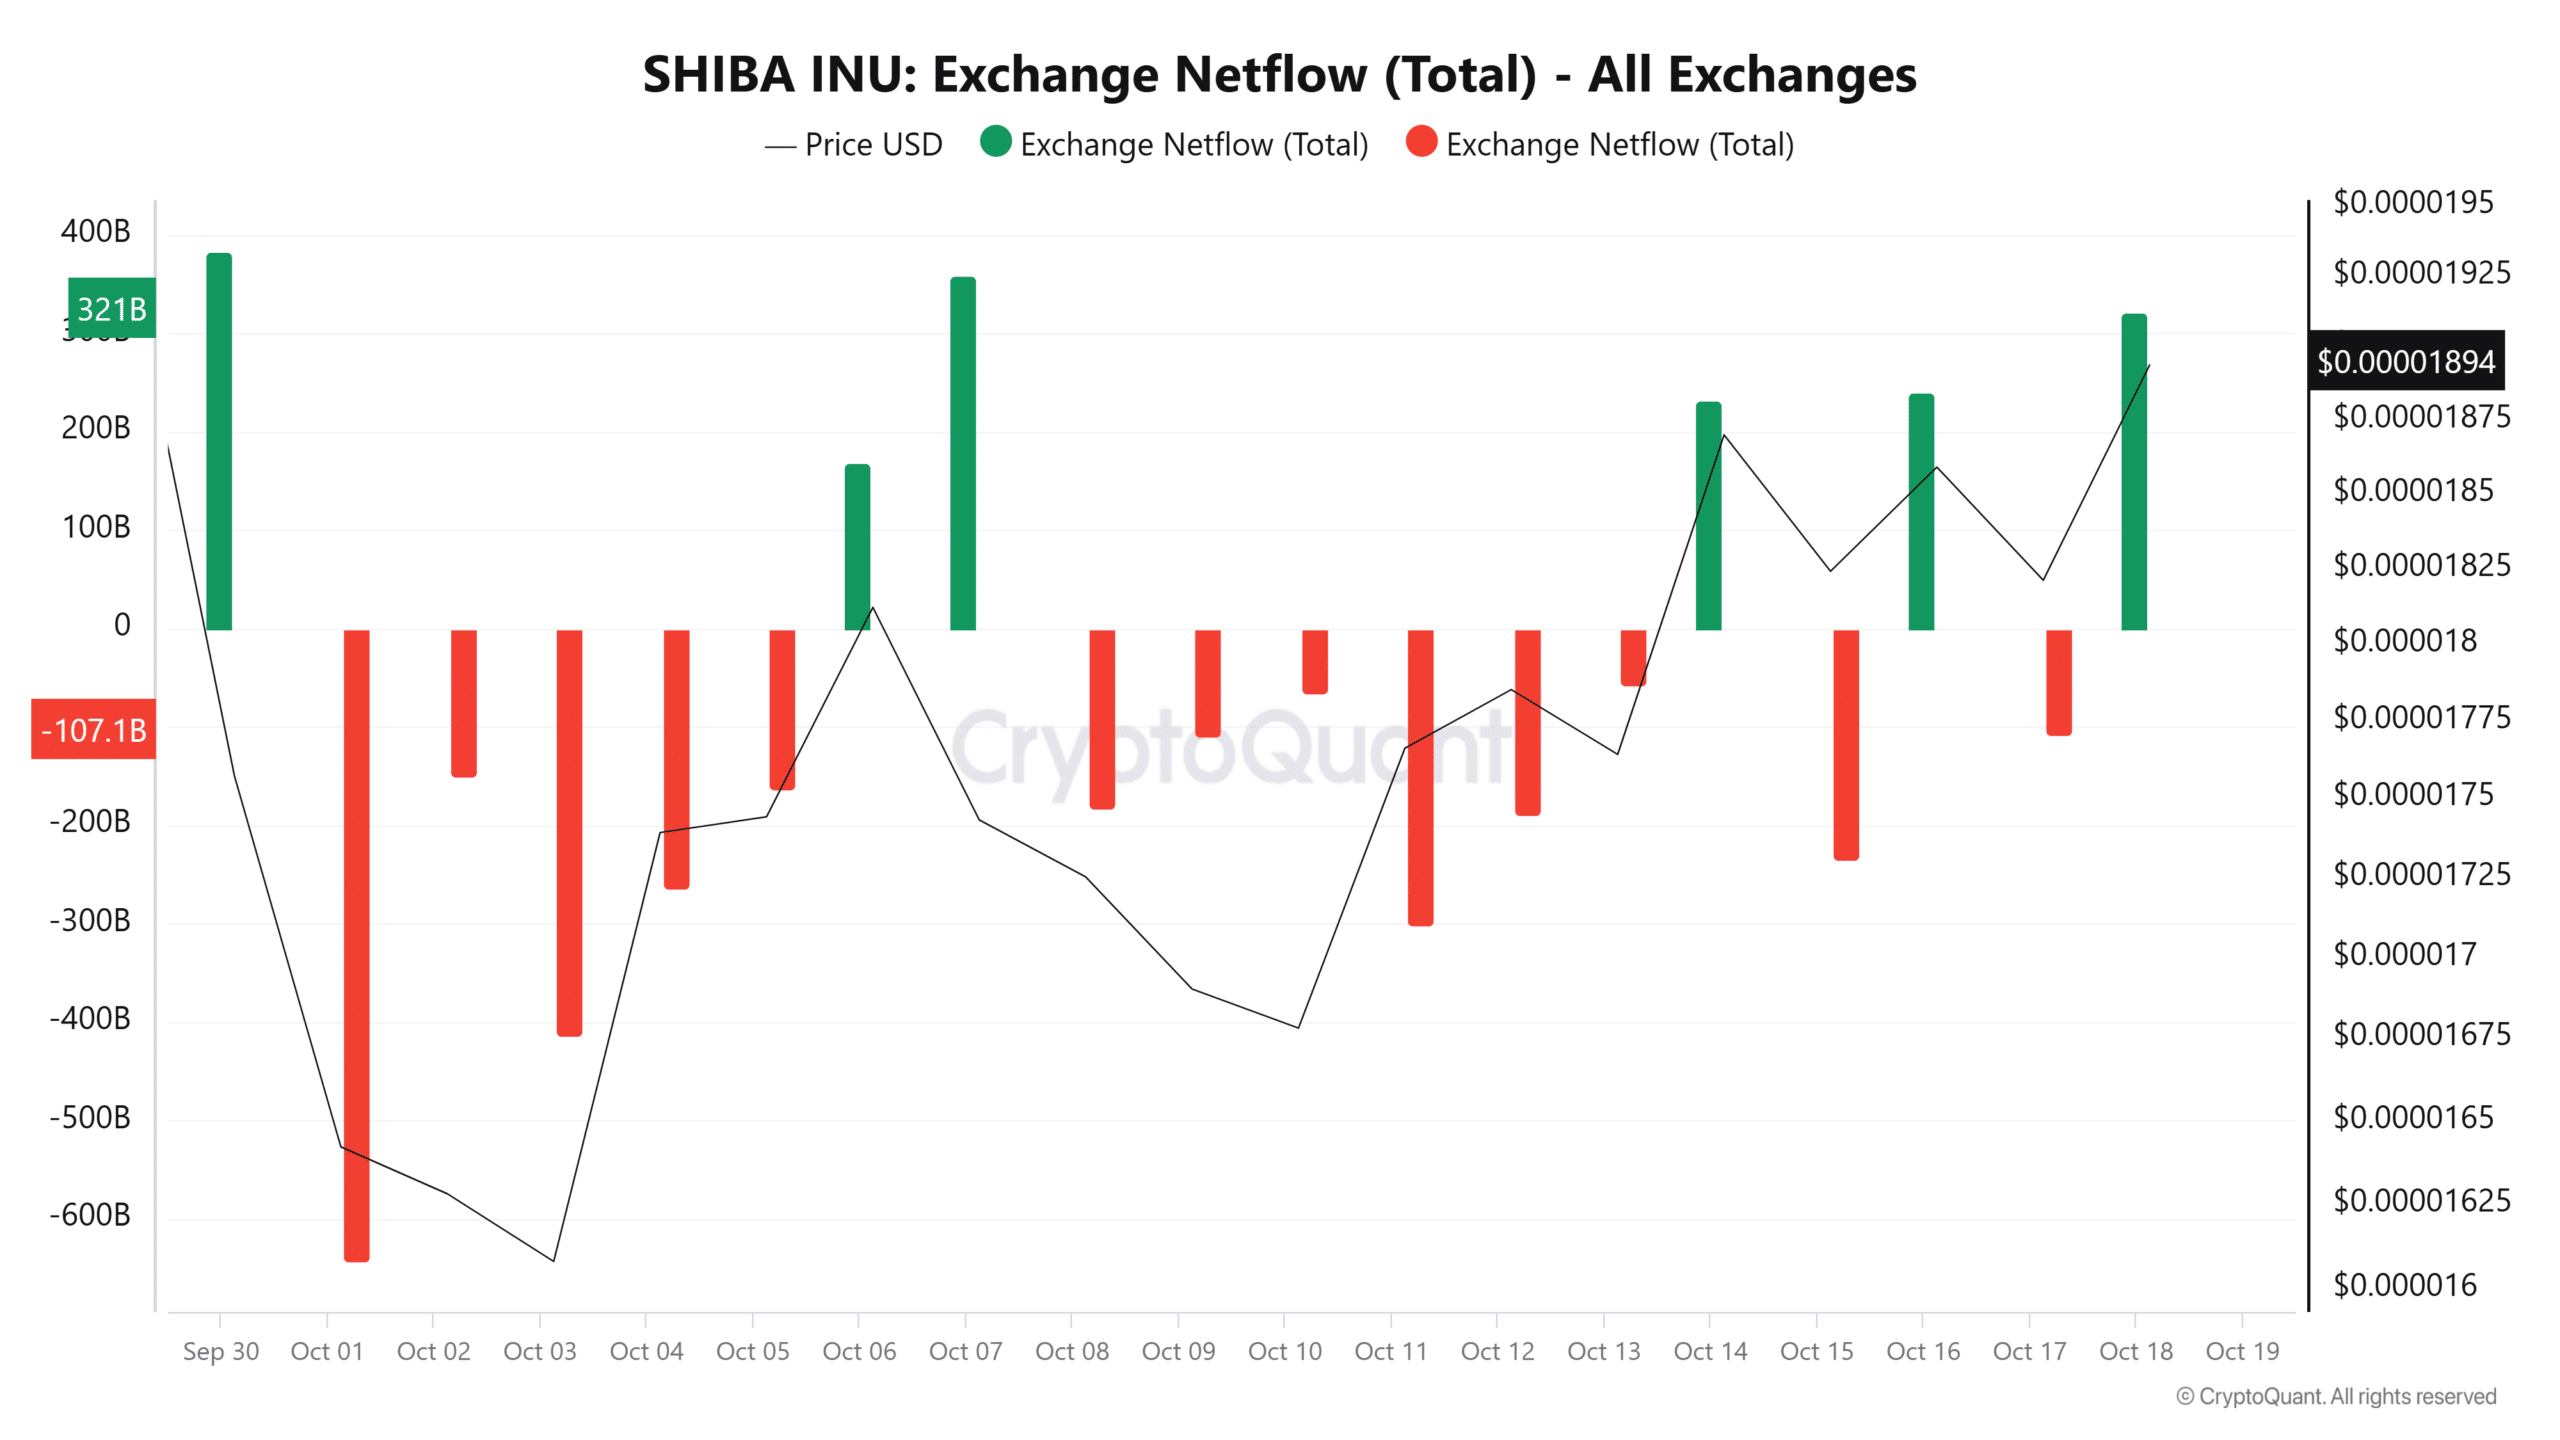
Source: CryptoQuant
If these tokens are sold, SHIB could see a spike in volatility and trade lower. However, a further look at technical indicators shows that buyers remain in control.
SHIB technical analysis
Shiba Inu has formed a bullish symmetrical triangle pattern on the daily chart suggesting that bulls could be taking charge. The Awesome Oscillator turned green as SHIB attempted an upward breakout from this pattern suggesting that the momentum is shifting from bearish to bullish.
A look at the Relative Strength Index (RSI) at 61 also shows that bullish momentum is in play. However, the RSI line has witnessed minimal fluctuations and was oscillating at near-flat levels suggesting that SHIB could be in a consolidation phase.
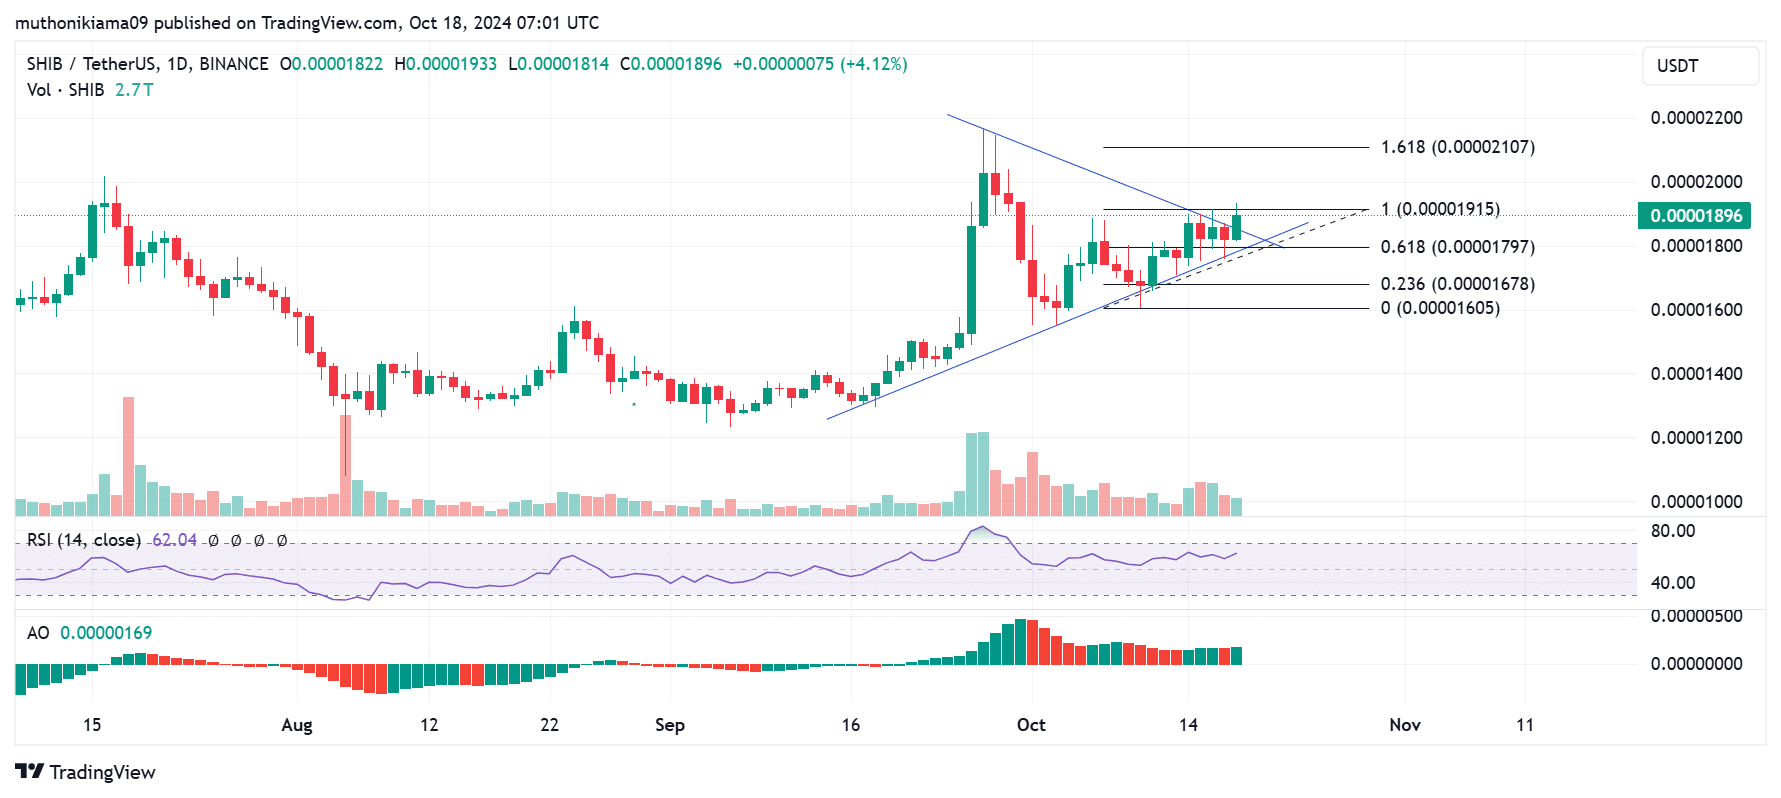
Source: Tradingview
Realistic or not, here’s SHIB’s market cap in BTC’s terms
If Shiba Inu confirms a breakout from this symmetrical triangle pattern, it could rally to the next resistance at the 100% Fibonacci level ($0.00001915). Consequently, if this breakout fails, the meme coin will test support at $0.0000179.
Data from Coinglass shows that 51% of traders have taken long positions on SHIB, an increase from the previous day’s 49%. On the other hand, short positions have dropped. This spike in traders betting on an uptrend highlights positive sentiment.