- While the recent surge revealed market confidence, overbought indicators and declining derivatives activity hinted at possible consolidation
- A strong rebound above $0.7 could renew bullish momentum while failure to sustain above this level may invite bearish pressure
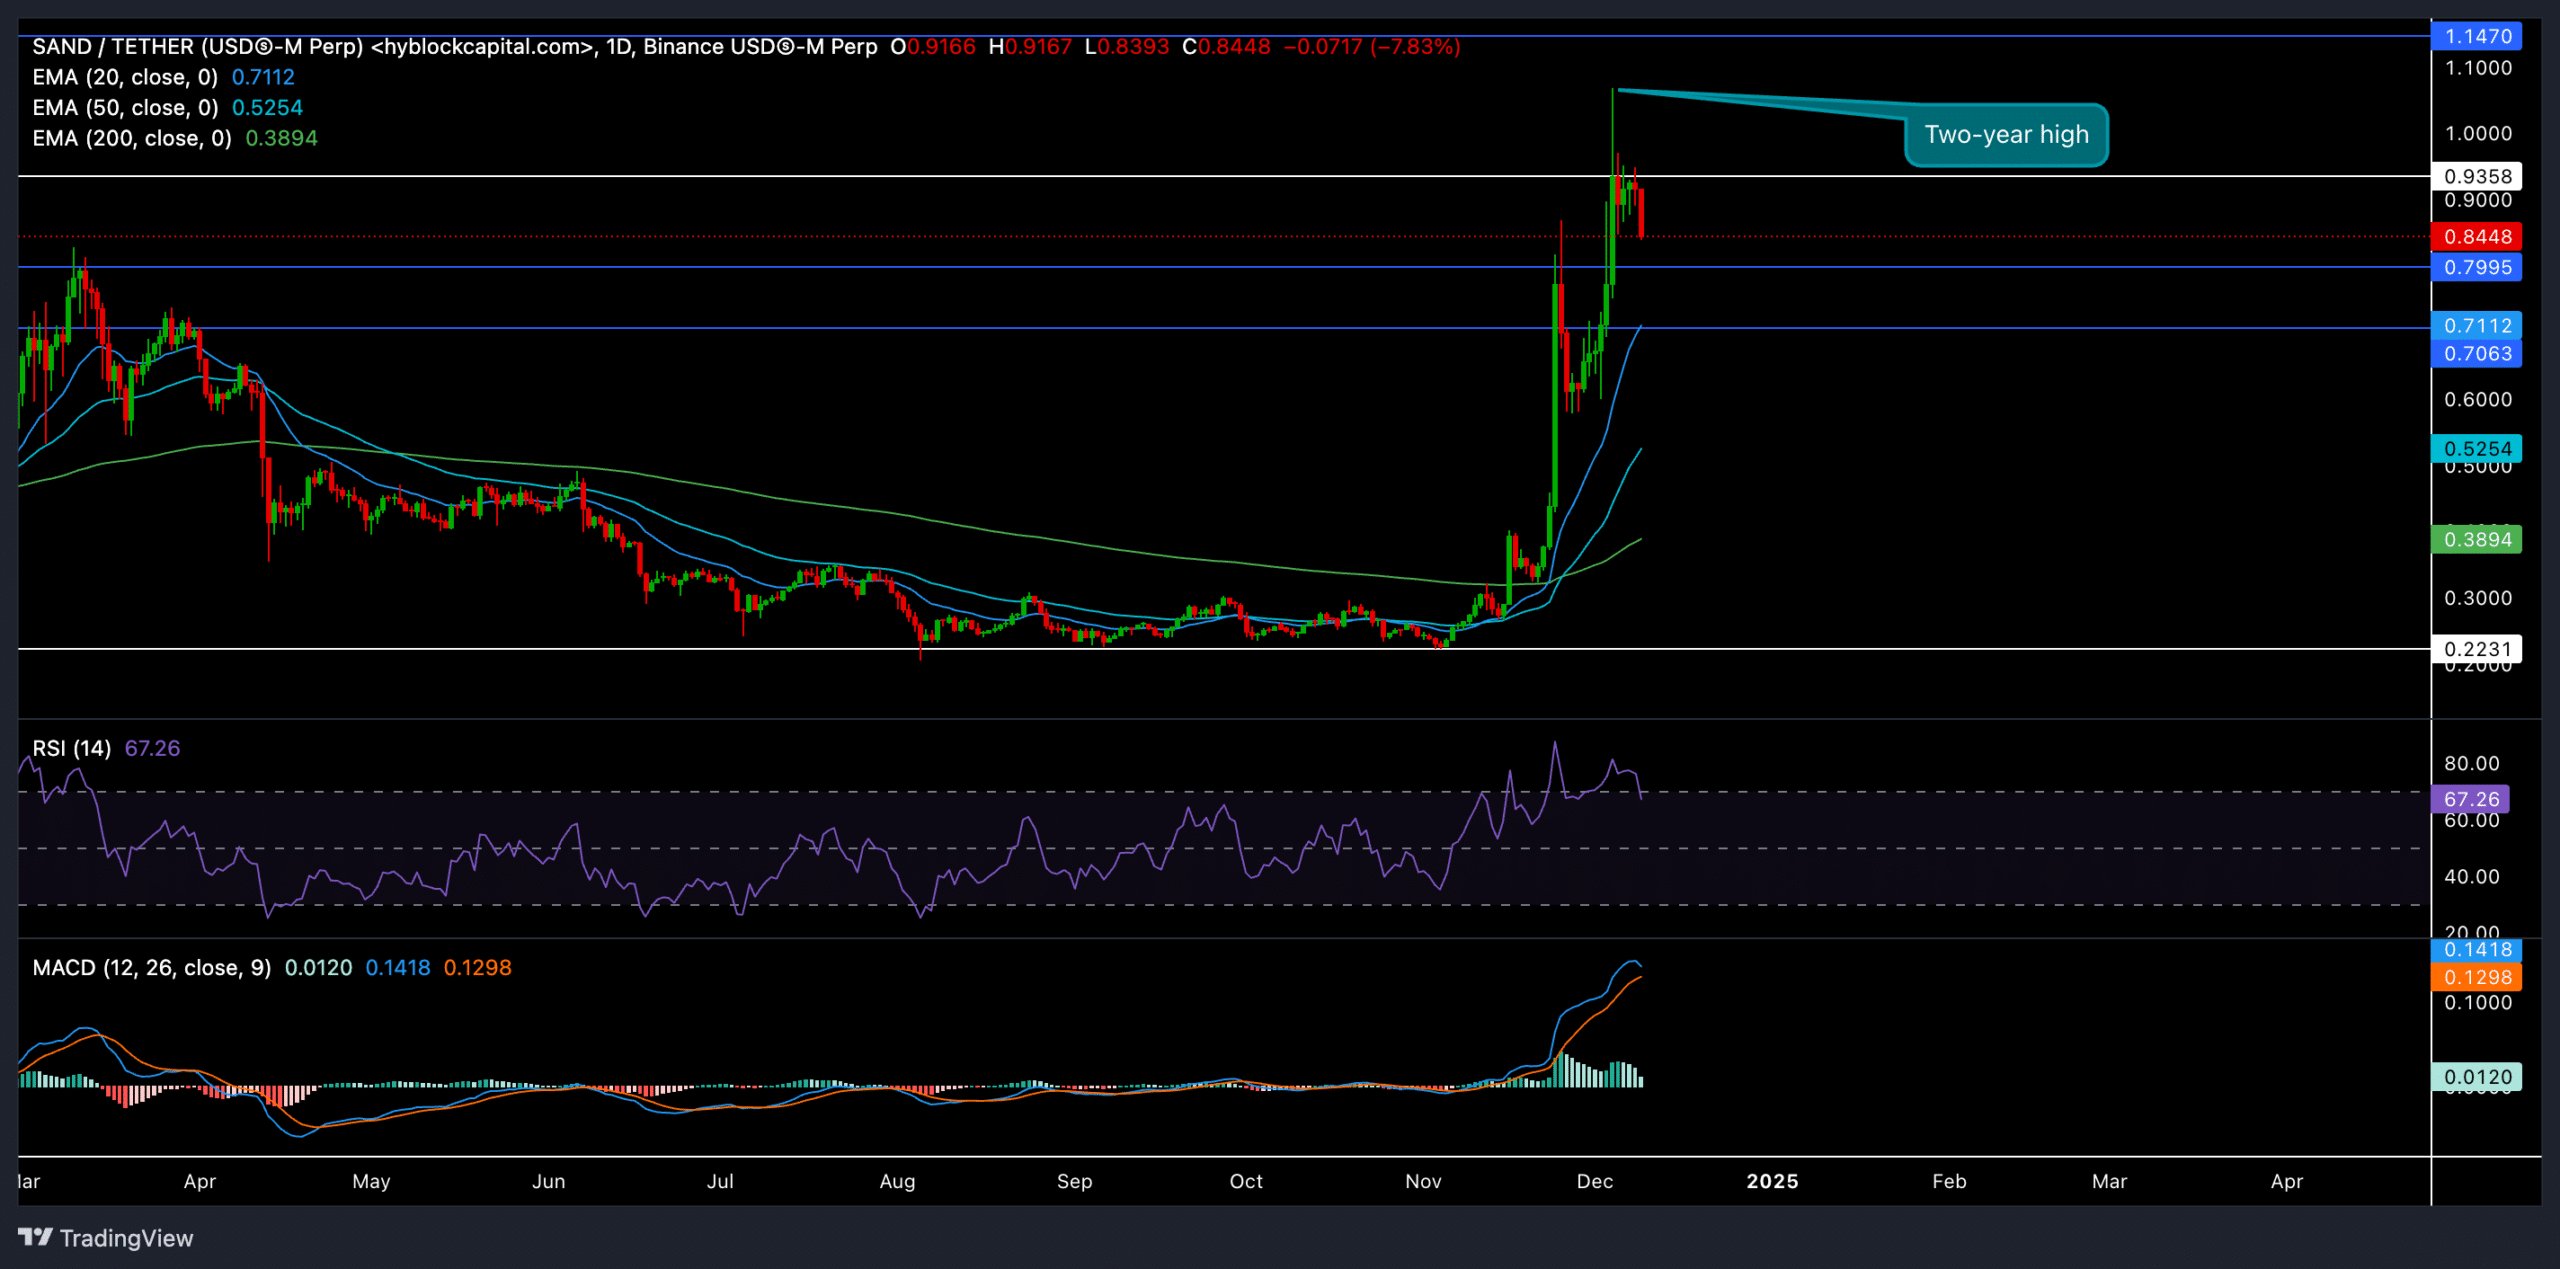
SAND recently saw a dramatic triple-digit rally, surging to touch its two-year high at $0.93 on 4 December. This explosive movement pushed the token well above its 20/50/200-day EMAs, reinforcing its bullish edge in the short to medium term.
However, the recent rally has left SAND at a critical juncture, with overbought signals and chances of consolidation ahead.
SAND saw a strong recovery above key support levels

Source: TradingView, SAND/USDT
SAND’s price action broke through major resistance levels, gaining traction as it reclaimed its position above the 20-day EMA and 50-day EMA. The surge helped SAND cross the psychological $0.7 support zone and test the immediate resistance at the $0.93-$1 range.
At press time, SAND was trading at approximately $0.86 after witnessing a nearly 5% decline over the past day. This correction occurred as the RSI entered the overbought territory, signaling a possible slowdown or consolidation phase. To prevent a further dip, buyers must defend the $0.7-level (which is aligned with high liquidity).
Should the bulls maintain their momentum, a rebound from $0.7 could allow SAND to retest $0.93 and break through to $1.1 – Its next major resistance. A decisive close above this level could reignite the rally, potentially pushing SAND towards the $1.4 zone.
On the other hand, a bearish BTC rally could see SAND sliding below $0.7. In this case, the next critical support level will be near $0.52 (50-day EMA).
The MACD indicator, at press time, reflected strong bullish momentum, with the MACD line well above the Signal line in positive territory. However, a bearish crossover or flattening of these lines could signal an easing of buying pressure.
Also, the RSI’s hike to overbought levels reinforced the likelihood of near-term consolidation. Traders should monitor this indicator closely, as any reversal below 60 could weaken bullish momentum.
Derivatives data revealed THIS


Source: Coinglass
SAND’s trading volume fell by 11.60% to $637.84M, signaling reduced activity following its recent rally. Also, Open Interest (OI) fell by 8.31% to $220.11M – A sign of cautious sentiment among traders.
Here, it’s also worth noting that the 24-hour long/short ratio stood at 0.8657 to favor short positions. However, major exchanges like Binance and OKX revealed a strong long bias, with ratios of 3.53 and 2.78, respectively.
Traders should watch for a clean breakout above $0.93 and monitor Bitcoin’s movement for broader market cues.

