- LTC seemed to be testing a critical trendline resistance
- Metrics pointed to a potential breakout on the charts
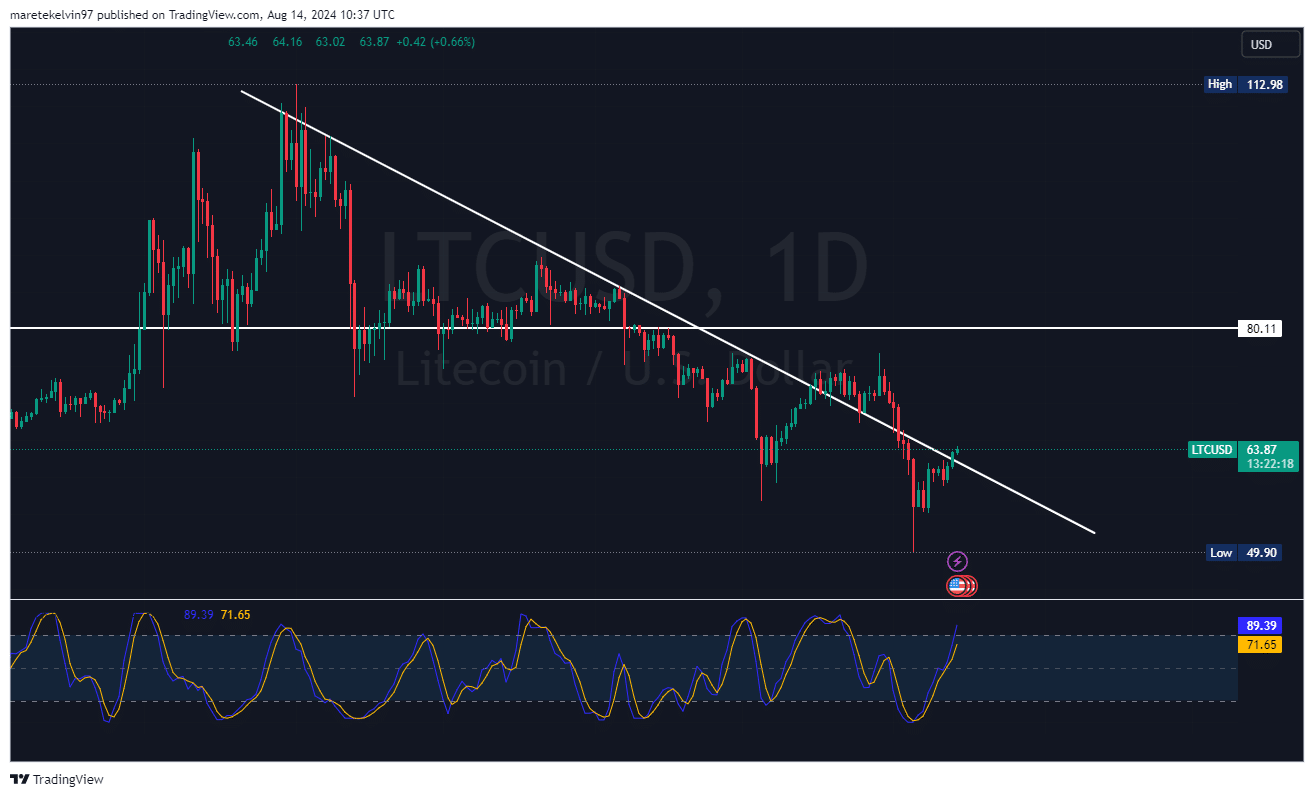
Litecoin (LTC), at press time, was standing at a crossroads, trying to break and stay above the key resistance trendline around $63.
In fact, LTC was seen approaching a bearish trend line too, one which has been acting as strong resistance since March. In other words, this level has rebuffed the altcoin’s upward advances on many occasions this year.
Nevertheless, there have been signs of increasing buying pressure over the last few trading sessions. The higher lows that LTC registered lately mean that now, buyers are getting more aggressive.

Source: TradingView
On the charts, the stochastic RSI was approaching an overbought zone. This can mean a possible price consolidation along the trendline. A short-term potential pullback may occur before further price rallies.
Altcoin’s Open Interest on the rise
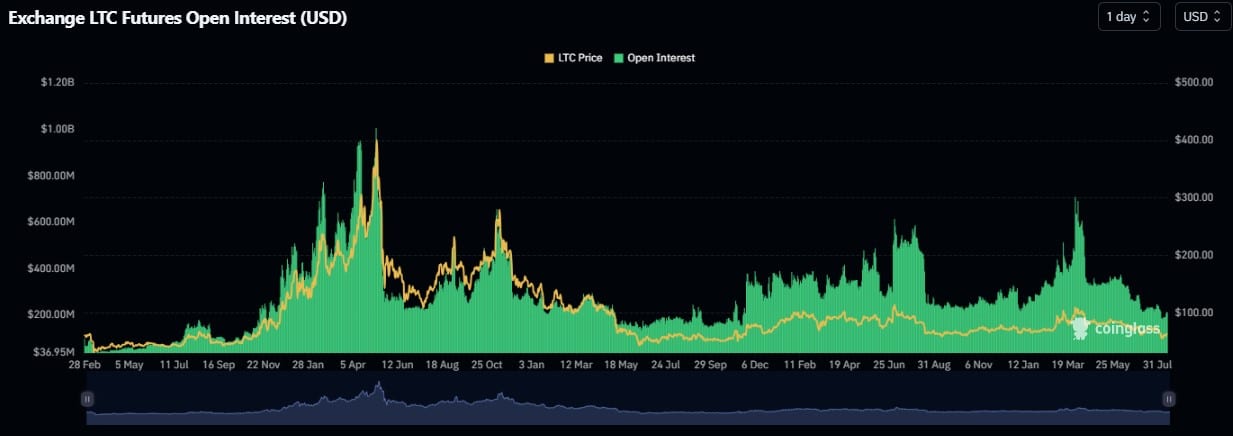
AMBCrypto’s analysis of Coinglass’s data indicated an uptick in the LTC’s future Open Interest.
This surge in market participation always leads to major price movements. As market participants position themselves, the chance for a potential breakout gets higher.


Source: Coinglass
According to the long/short ratio data, there may be a slight bias towards long positions too.
This seemed to imply that the overall market sentiment is slightly bullish, as more traders are anticipating a higher price direction. Nevertheless, the ratio, at press time, was still quite stable, which may suggest that market participants are being more careful at the moment.


Source: Coinglass
Is a liquidation squeeze in the making?
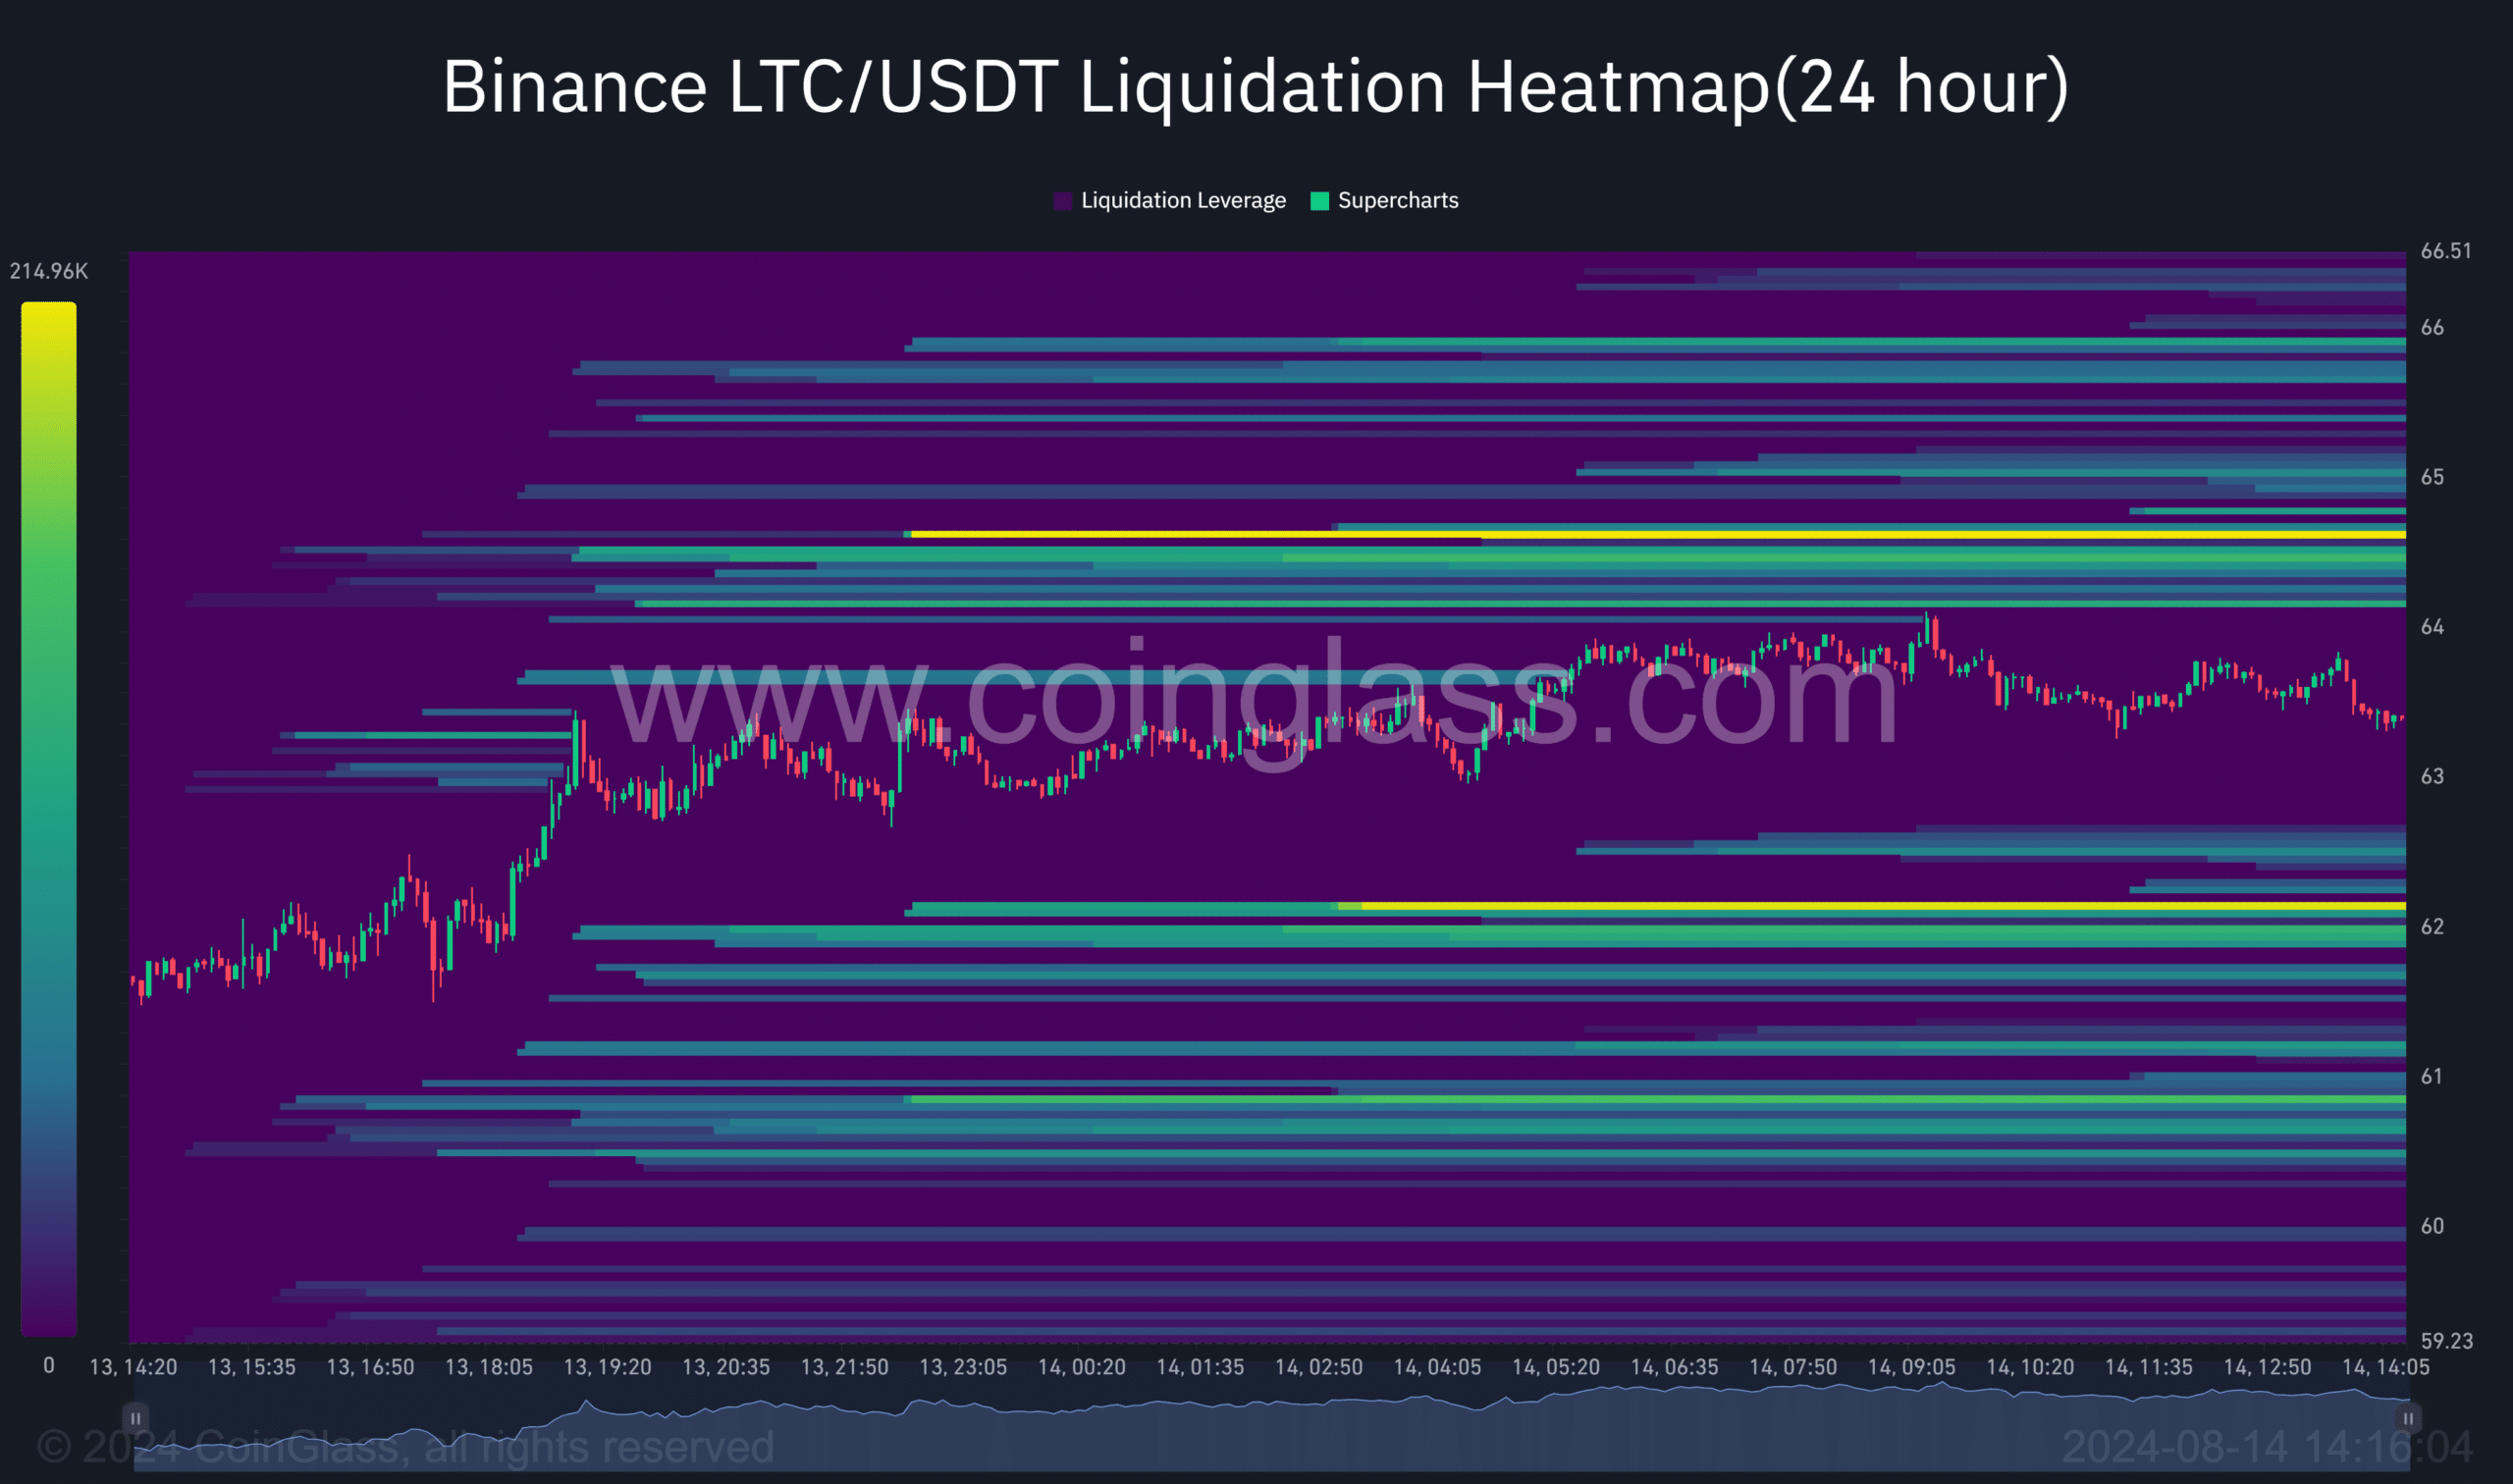
Finally, the liquidation heatmap data indicated that there were many short positions located above its press time price.
If LTC manages to overcome the trendline resistance, it could trigger a series of liquidations. This buying pressure could force the upward movement to progress even further, which could translate to a massive rally.


Source: Coinglass
If LTC break above $63 with strong momentum, it could confirm this bullish scenario.
Conversely, a rejection at this level might signal further consolidation or a potential downside move on the charts.

