- Both Litecoin and XRP registered double-digit growth last week.
- LTC’s network activity remained considerably higher than that of XRP.
As the crypto market turned bullish, most cryptos, including Litecoin [LTC] and Ripple’s XRP, registered greens on their price charts.
However, if the latest analysis is to be considered, then LTC might be preparing for a rally that might end up outperforming that of XRP’s. Let’s have a closer look at which crypto was positioned better in the short term.
Litecoin and XRP bulls are here
CoinMarketCap’s data revealed that both of these cryptos’ prices gained bullish momentum last week. To be precise, XRP’s price increased by more than 26% last week, while LTC witnessed a 13% price rise.
At the time of writing, XRP and LTC were trading at $0.53 and $70.6, respectively.
Thanks to the recent price gains, both of these cryptos’ weighted sentiment also went into the positive zone. Such a development means that bullish sentiment around them is increasing in the market.
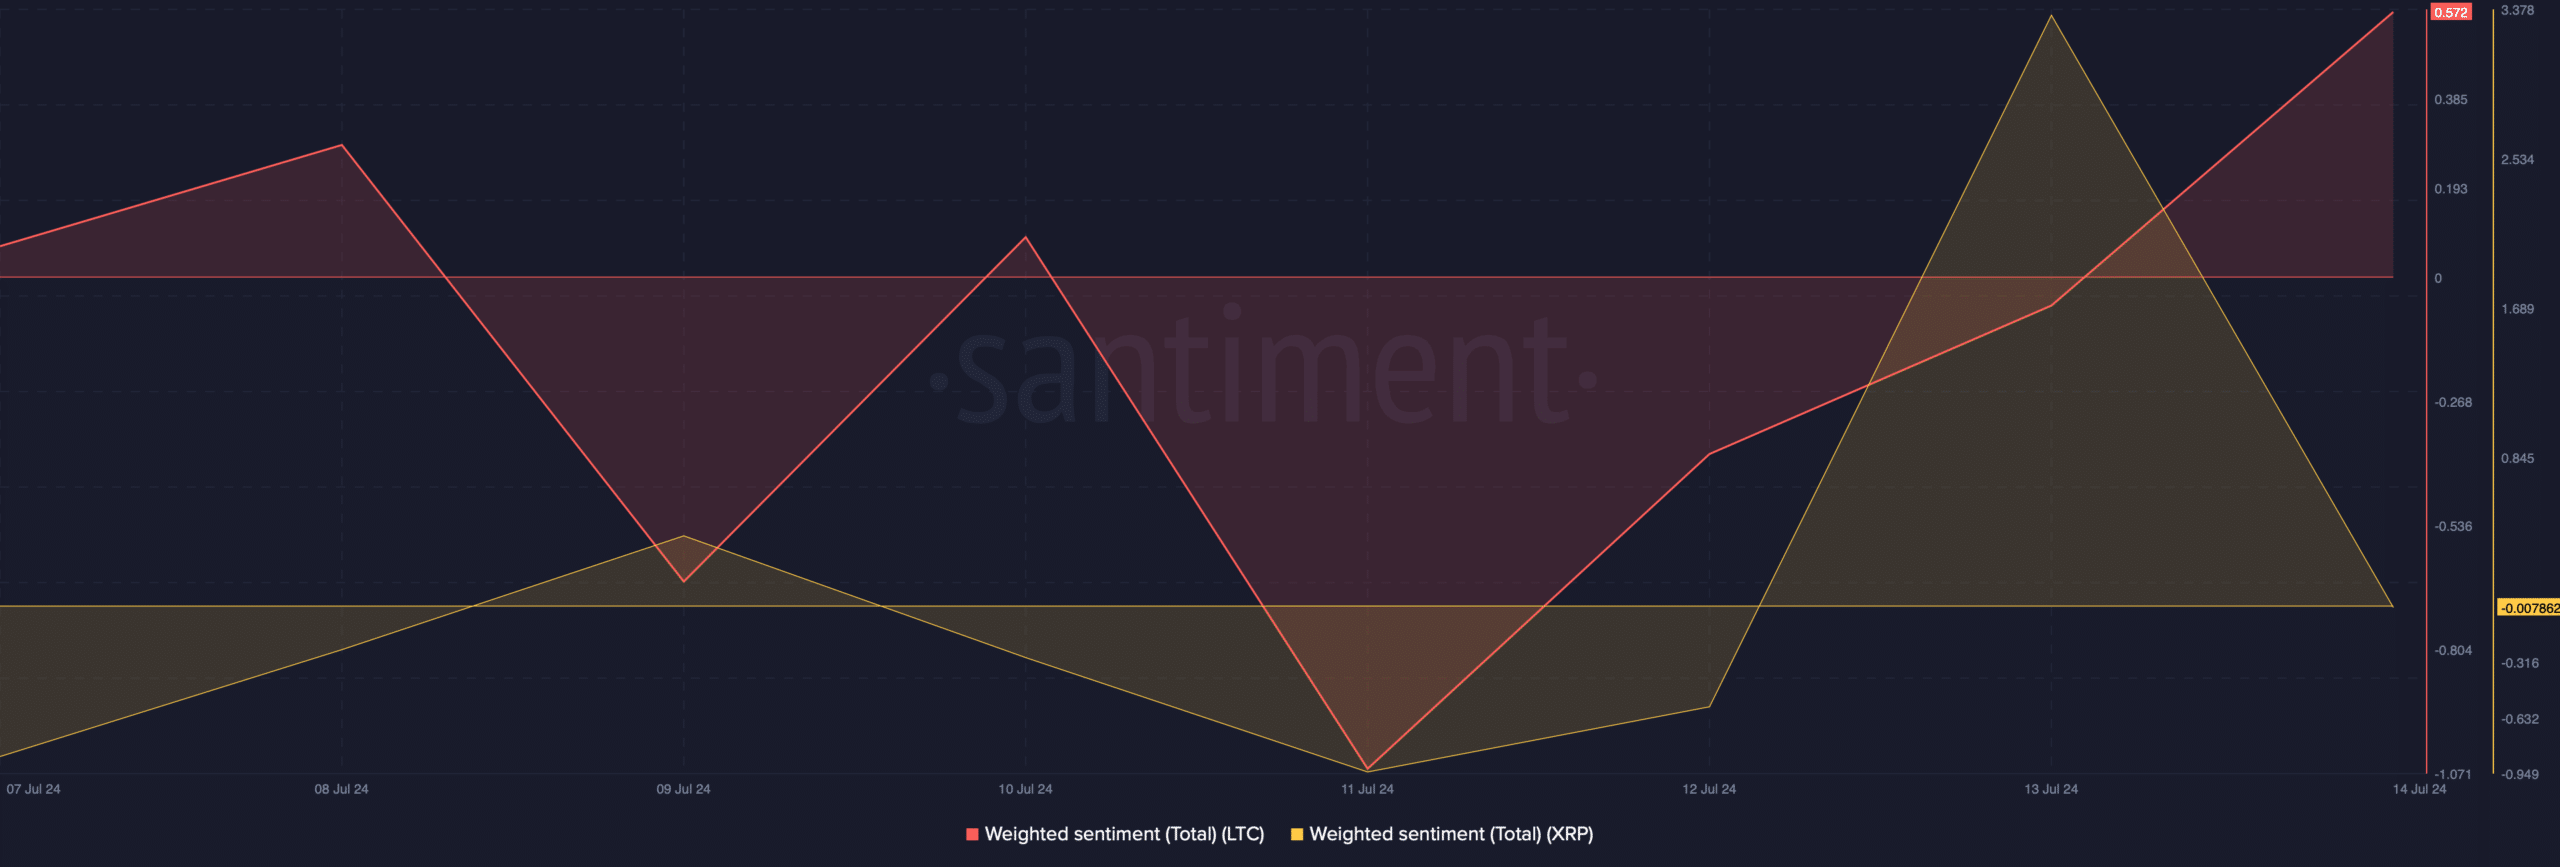
Source: Santiment
Though XRP’s gains were nearly double those of LTC, the latest analysis suggests that LTC could take the lead in the long run.
Master, a popular crypto analyst, recently posted a tweet revealing how the LTC/XRP chart has been consolidating inside a pattern.
A breakout above the pattern could trigger a rally, which could result in exponential growth for LTC, allowing it to possibly outshine XRP in the coming months or years.

Source: X
LTC vs XRP
Since there were chances of LTC outperforming XRP in the long term, AMBCrypto analyzed their metrics to find out what to expect from them in the short term.
AMBCrypto’s analysis of Santiment’s data revealed that both Litecoin and XRP’s MVRV ratio improved last week, which can be inferred as a bullish signal. While XRP’s MVRV ratio stood at 11.8%, LTC’s metric reached 15%.
However, Bitcoin remained the clear winner in terms of network activity. This was evident from the sheer higher number of LTC’s daily active addresses compared to those of XRP.
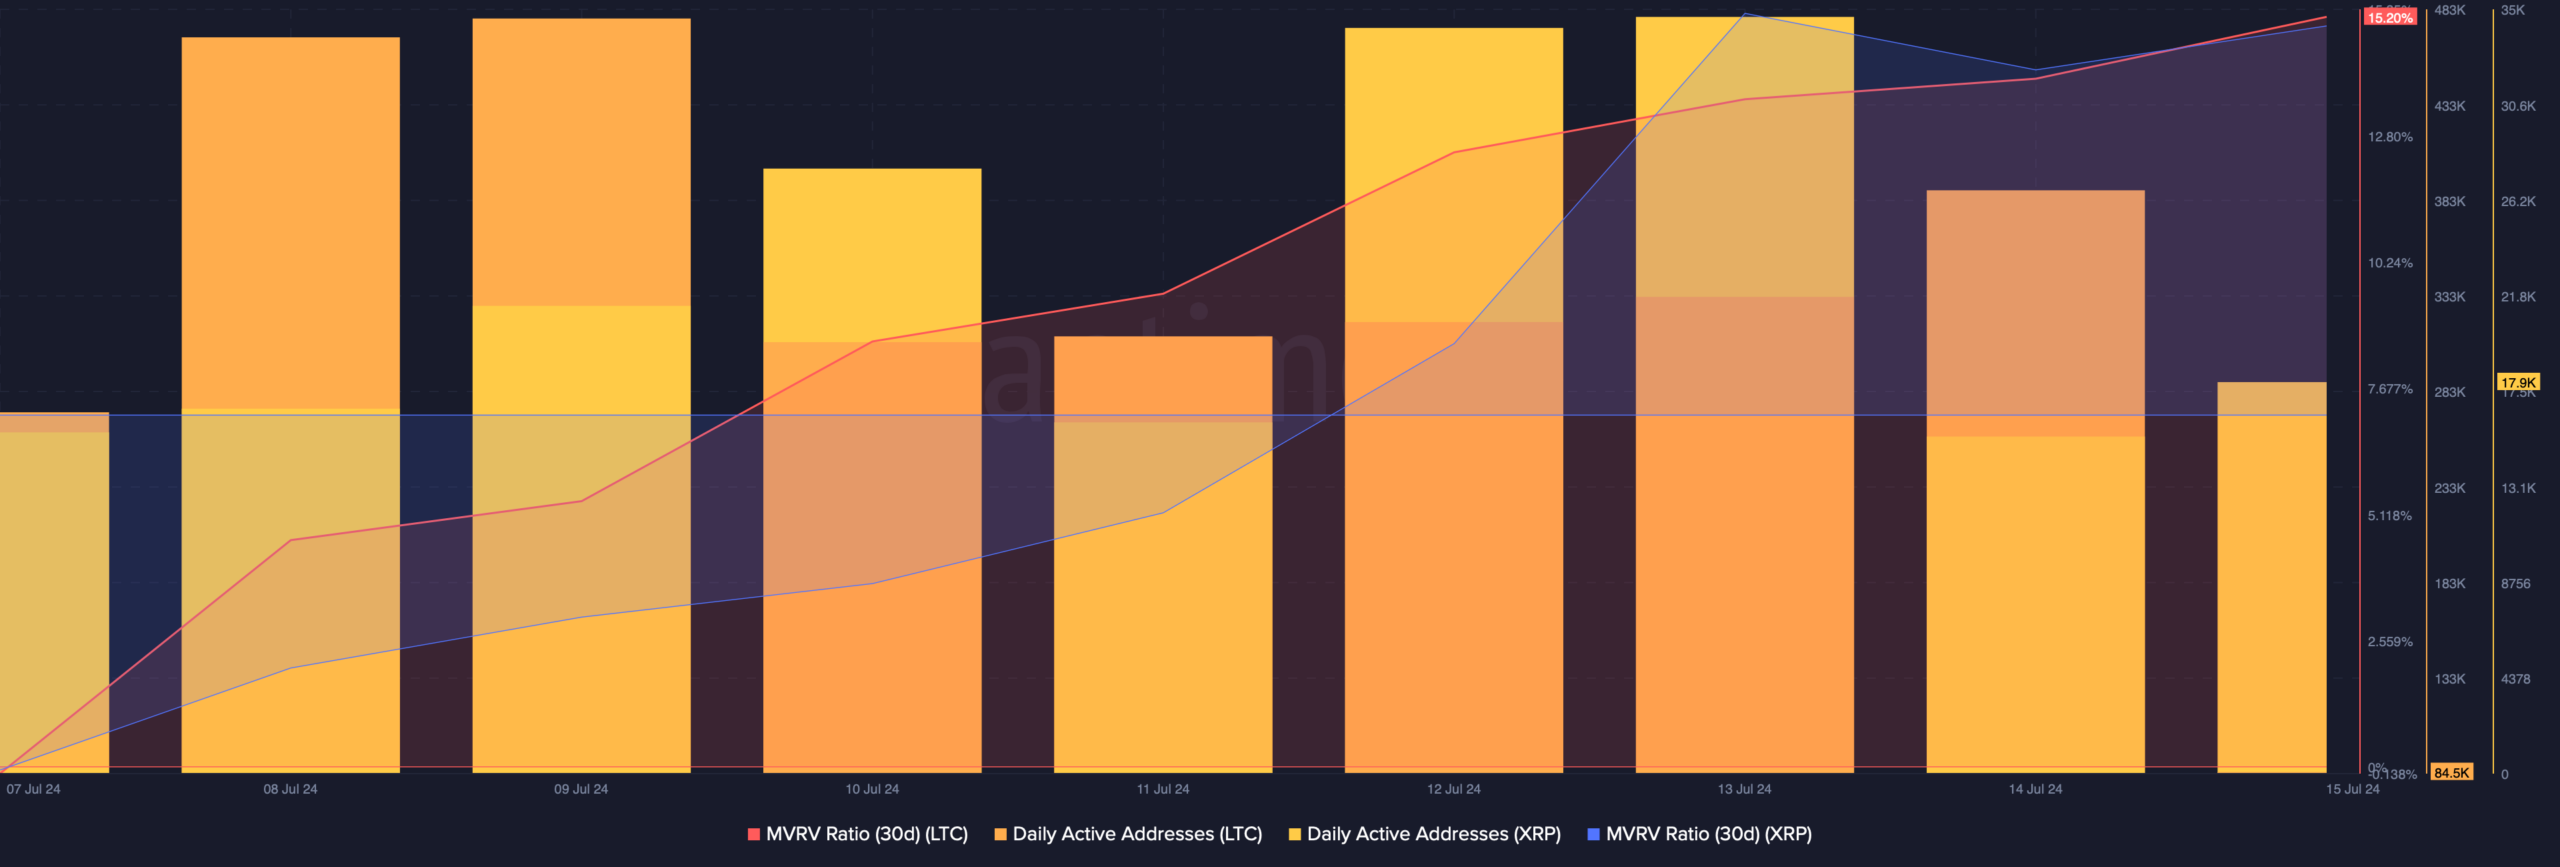
Source: Santiment
Our analysis of LTC’s daily chart revealed a few bullish signals. For instance, the MACD displayed a bullish advantage in the market.
The Relative Strength Index (RSI) registered an uptick, hinting at a continued price rise. But the Chaikin Money Flow (CMF) suggested otherwise, as it dropped.
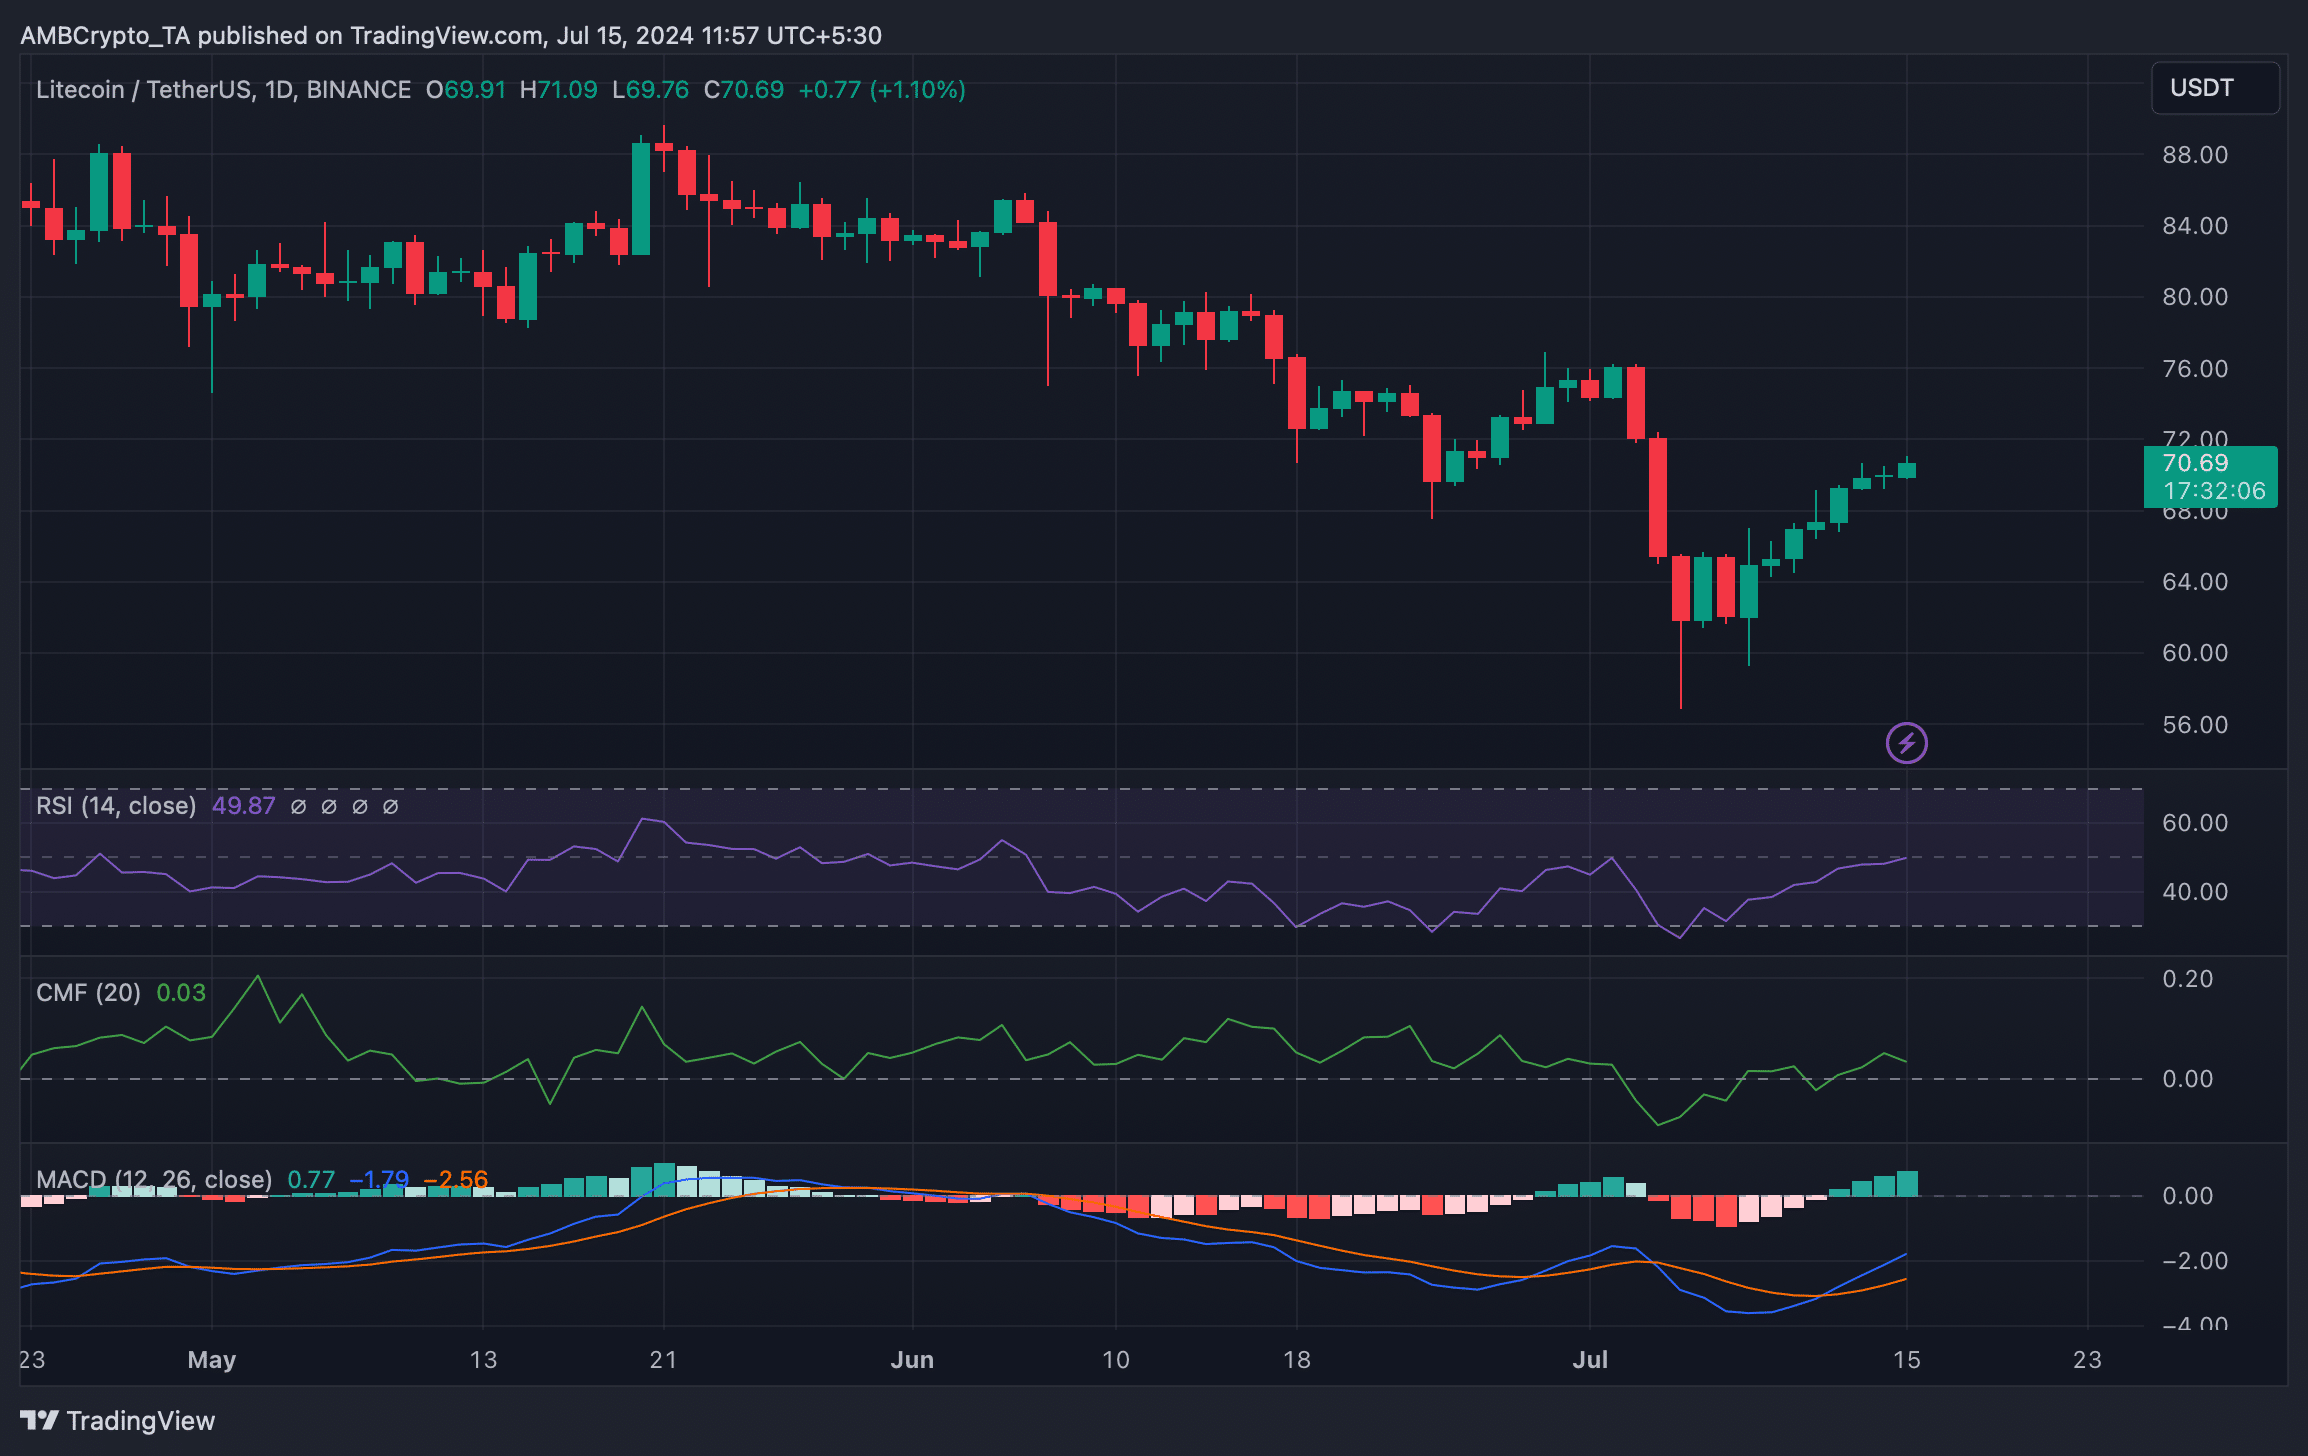
Source: TradingView
Is your portfolio green? Check the Litecoin Profit Calculator
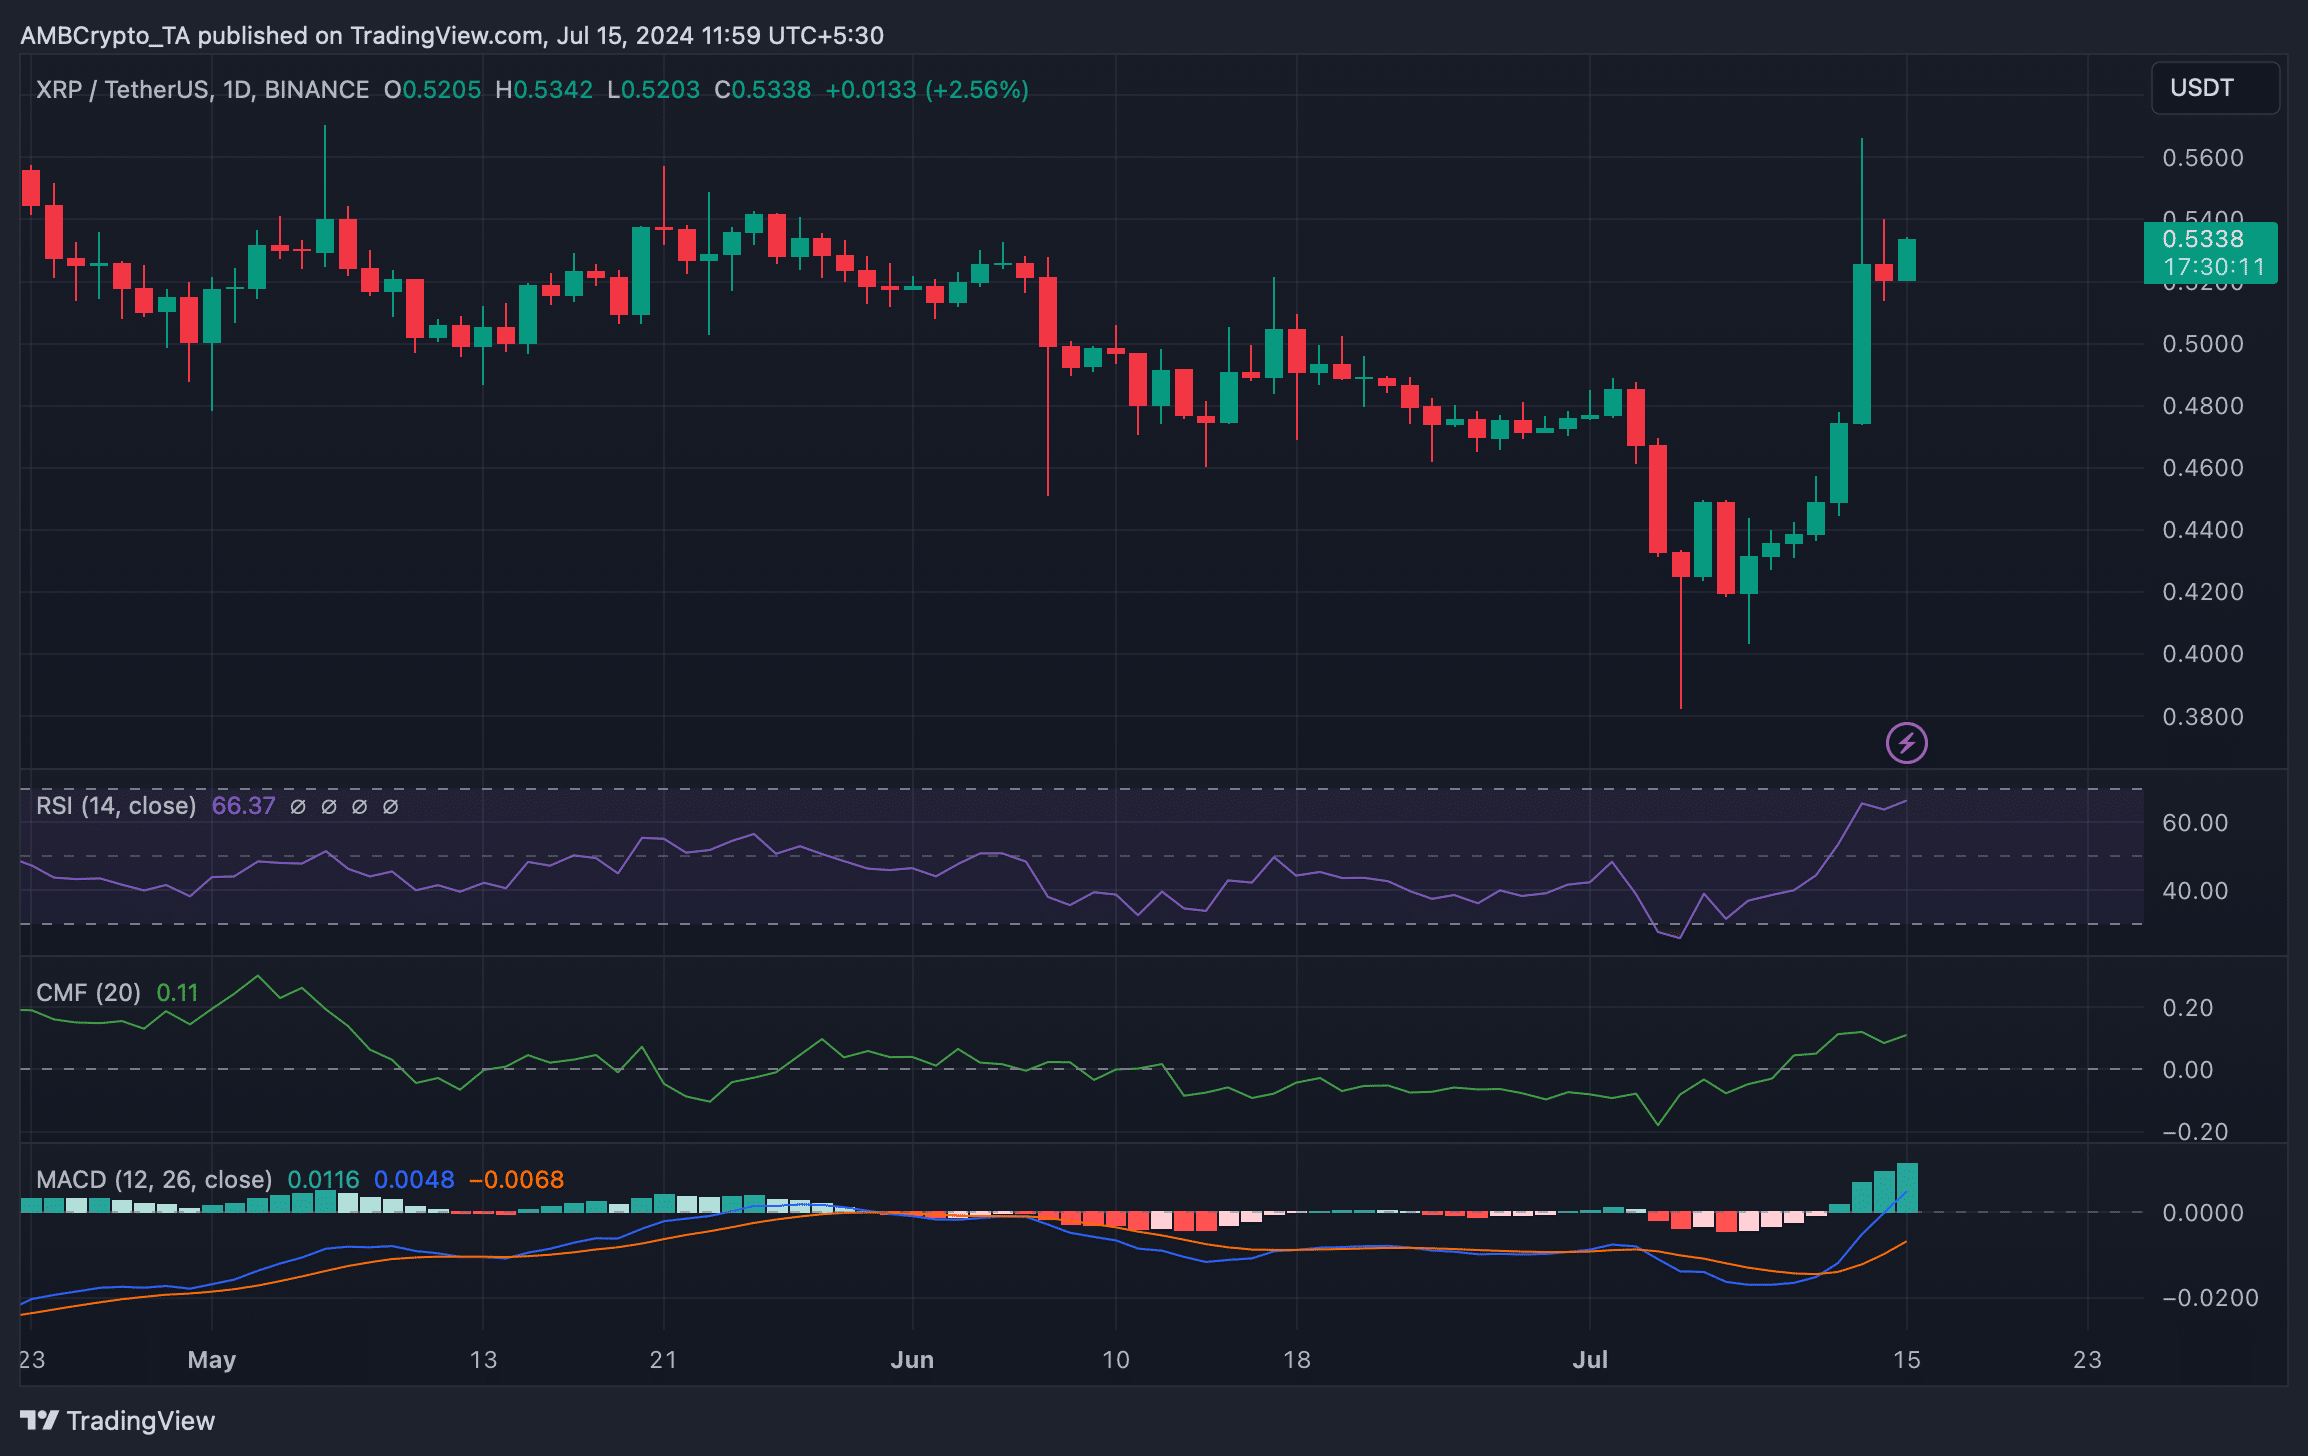
Nonetheless, XRP’s position looked more stable as all of the aforementioned indicators were bullish. For example, both its Chaikin Money Flow (CMF) and Relative Strength Index (RSI) registered promising upticks.
Like LTC, XRP’s MACD also displayed a bullish upper hand in the market. If these were true, then it would take longer for LTC to outperform XRP.
Source: TradingView