
- Bitcoin leads the crypto space despite market-wide uncertainty on the price front
- Blackrock is continuing to buy more BTC, despite weak hands capitulating
It’s been an interesting time for many of the market’s biggest cryptocurrencies, with the likes of Bitcoin stabilizing on the charts after a bout of depreciation a few days ago. At the time of writing, it was trading just above the $64,000-level, down by less than 0.5% in the last 24 hours.
The market’s altcoins weren’t immune to such stagnancy either, with the likes of ETH, SOL, and XRP trading close to their $3159, $164.59, and $0.5966-levels, at press time.
Even so, the broader crypto-market’s sentiment remains cautiously optimistic. This, despite DOGE and SHIB trading within their warning zones on the charts.
Blackrock’s influence on BTC’s future price
Blackrock’s increasing involvement in the crypto-space, despite the recent dumping, is a strategic move to capitalise on market sentiment, particularly when the fear and greed index is ruling.
Things are about to get intense as companies, institutions, and whales have continued to scoop up thousands of Bitcoin as popular analyst Lark Davis noted.
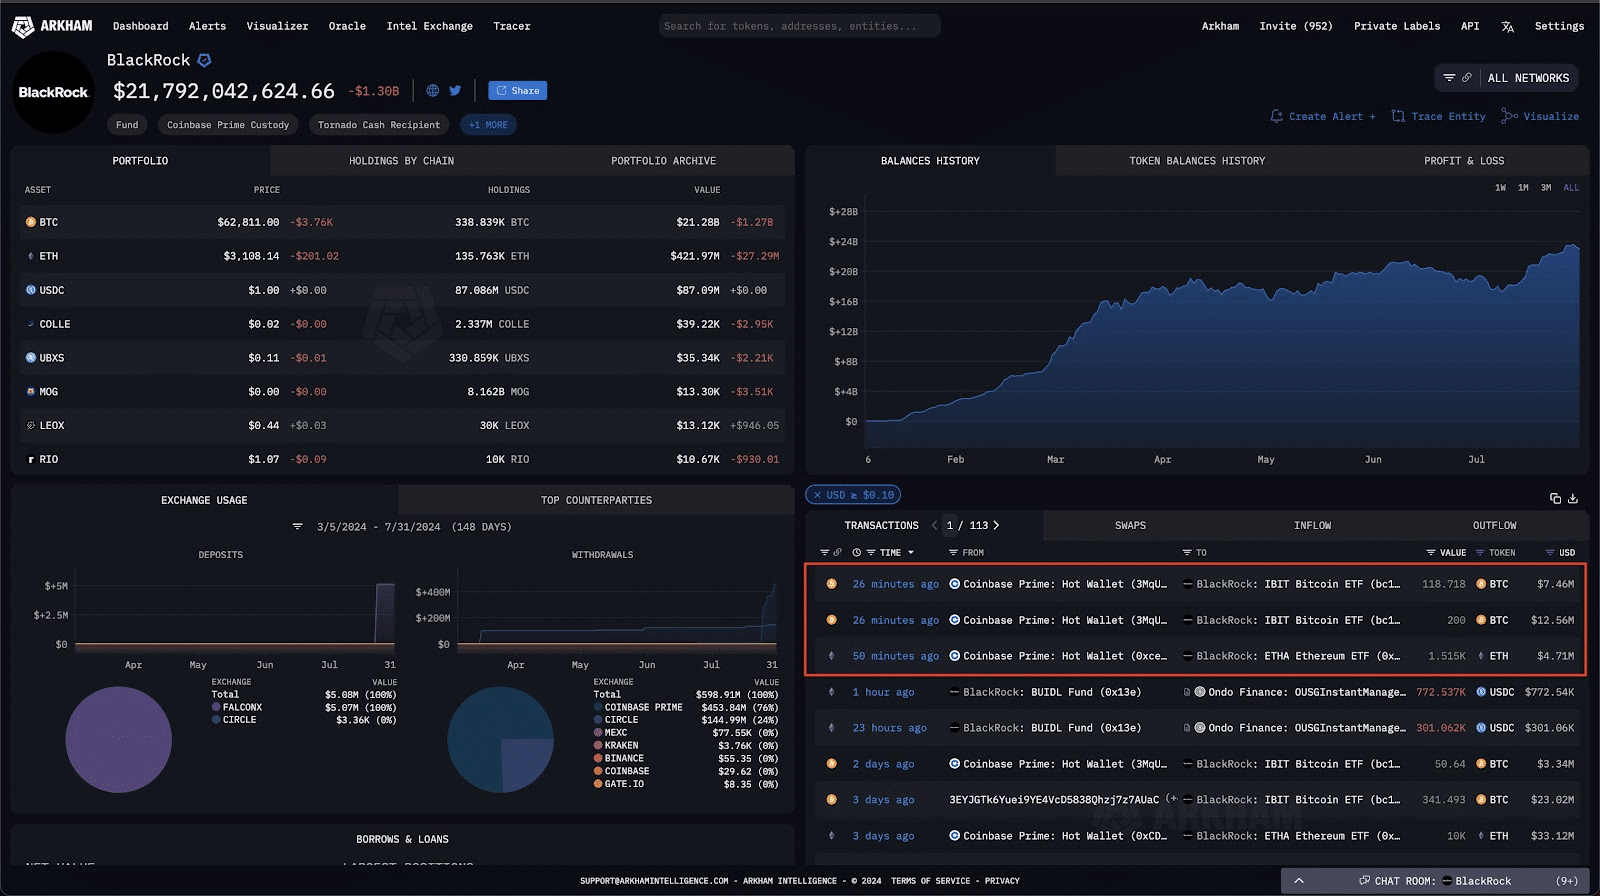
Source: Arkham Intelligence
The timing is especially crucial here since it comes after Russia’s new bill on Bitcoin mining and crypto payments for international trade with strict regulations.
Cumulatively, these could lead to BTC recording some major price movements, based largely on investments and market psychology.
RSI analysis suggests 2017 run could repeat itself
At the time of writing, Bitcoin’s RSI was hovering around a level of 65. This can be interpreted to be the precursor to a major bull rally.
Historically, RSI values have often been used to predict an asset’s future price action, as crypto analyst Quinten noted on X using this key metric.
Monitoring Bitcoin’s RSI trends will be crucial here.
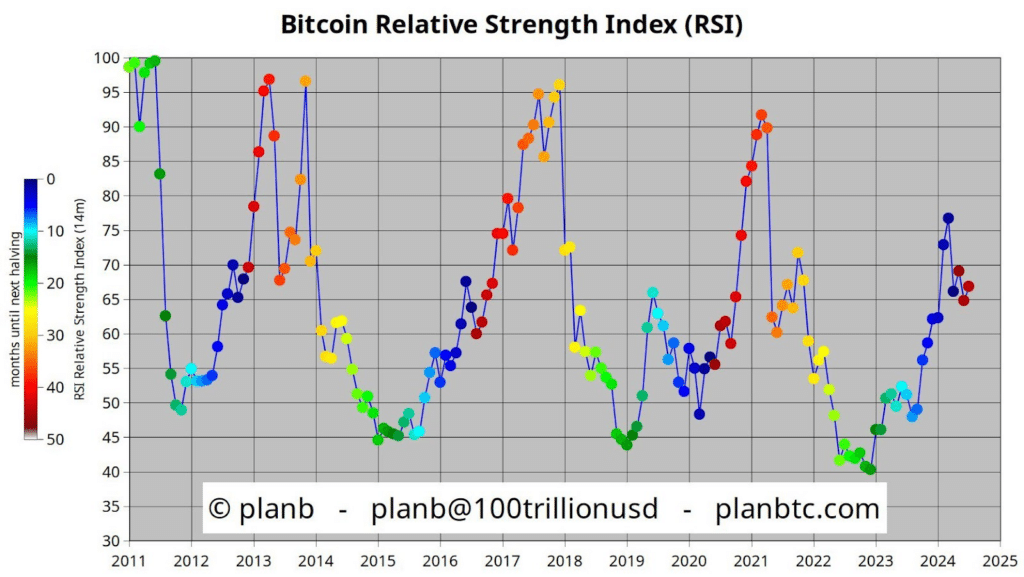
Source: PlanBTC
Bull & bear index shaping the future price of BTC
Here, it’s worth looking at other datasets too. On-chain metrics such as wallet activity and transaction volumes, for instance, revealed heightened accumulation by long-term holders.
Additionally, the Bull & Bear index had a reading of 0.56 too – Another sign of BTC being in an accumulation phase.
This trend often precedes an asset’s bullish price action, supporting the hypothesis of a potential price surge in the future.
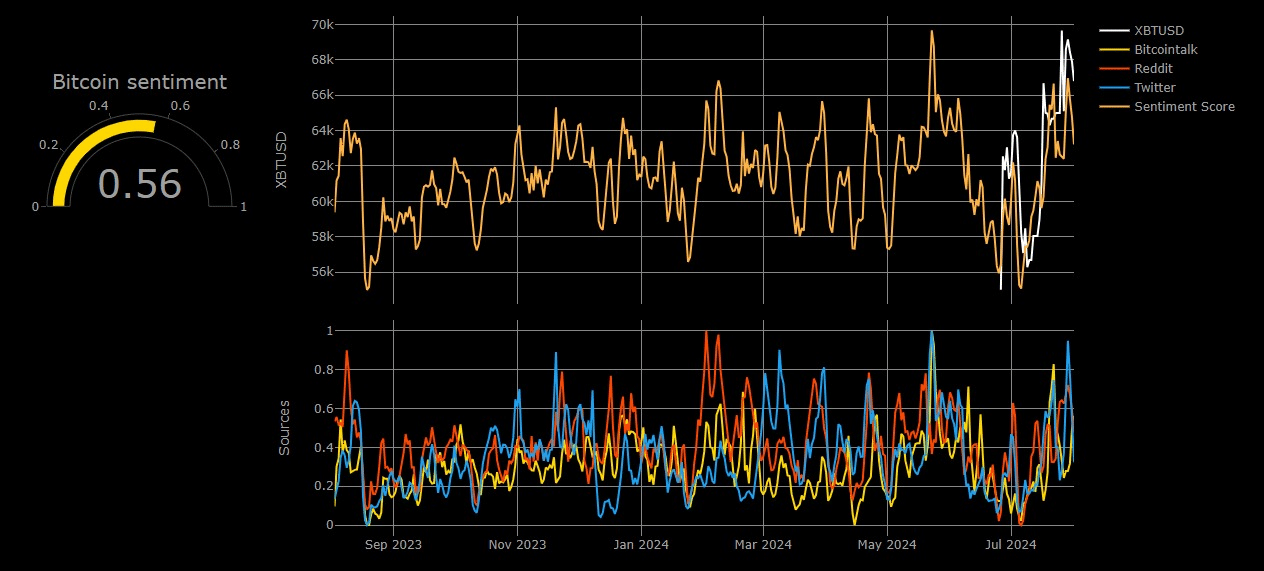
Source: Augmento
What a wedge breakout means for BTC’s price
Finally, BTC’s rising wedge pattern has broken to the downside as we anticipated earlier to run on stops resting below the trendlines.
This will trap the bears and send back the price to above the $70k level in Q4. In fact, while the crypto’s price has been in consolidation lately, it has just shown early warning signs of an upward trajectory on the charts.
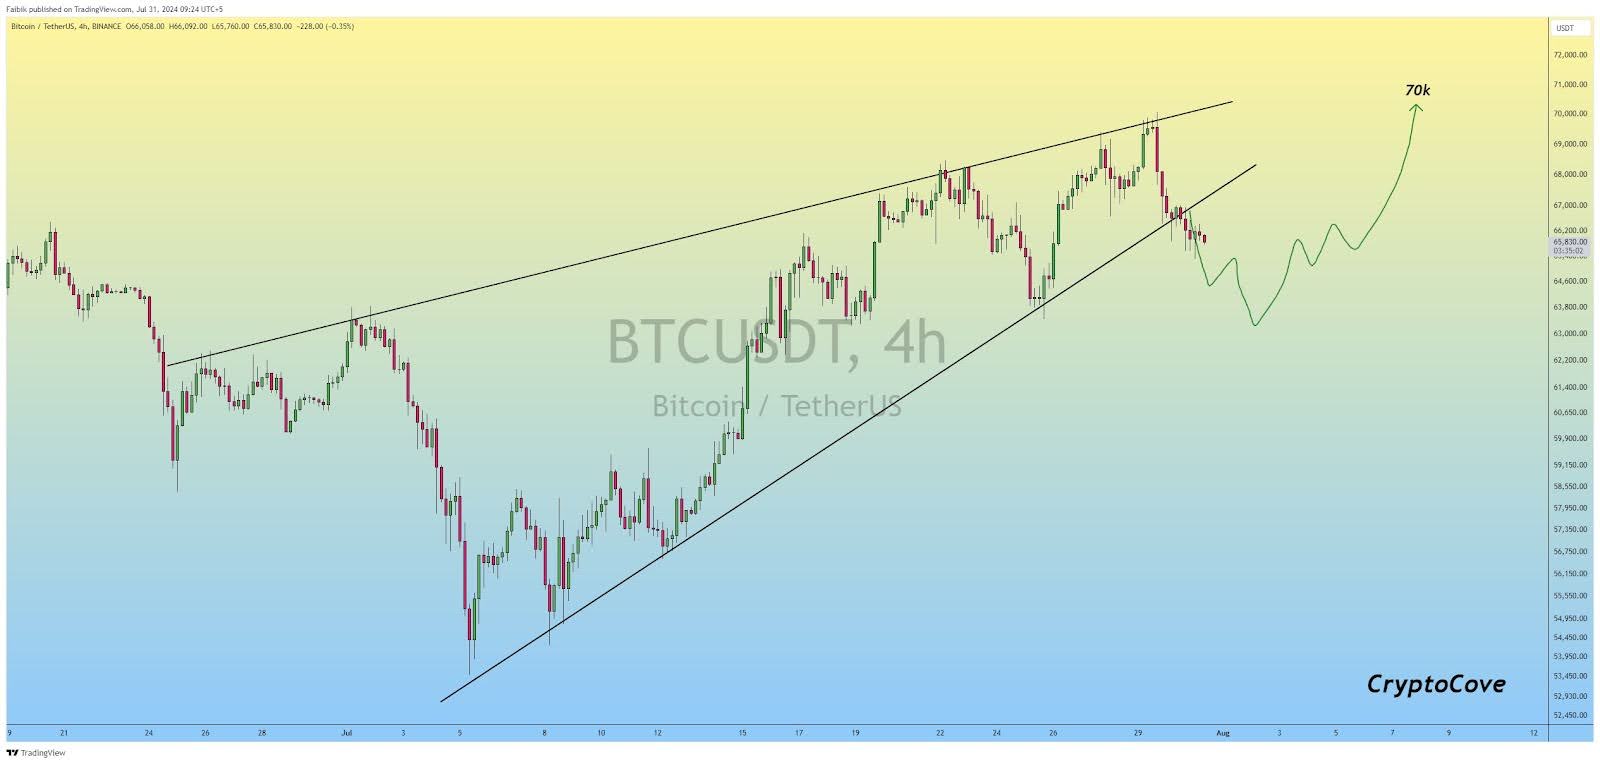
Source: TradingView
Breaking above the $70k key resistance zone could spur a run towards the $100k psychological level.
Based on technical indicators, on-chain data, and external influences like Blackrock’s involvement, Bitcoin has the potential to repeat its historic price movements.