
- PEPE’s price was consolidating in a symmetrical triangle, with a potential breakout in sight.
- Metrics indicated a potential breakout.
PEPE has been in a narrowing price range while forming a symmetrical triangle pattern for the last four weeks.
The memecoin’s price has dipped by 13% since testing the symmetrical triangle resistance level at $0.00001348 over the past week as well. This consolidation phase often precedes significant price movements.
According to CoinMarketCap, as of press time, PEPE was trading at $0.00001152, a 0.02% increase over the past 24 hours. This minor gain suggested the token was maintaining stability despite broader market fluctuations.
PEPE’s market capitalization was $4.84 million, positioning it as the 23rd largest cryptocurrency. However, trading volume has seen a significant drop of 19.79%, with $413.8 worth of PEPE changing hands in the last 24 hours.
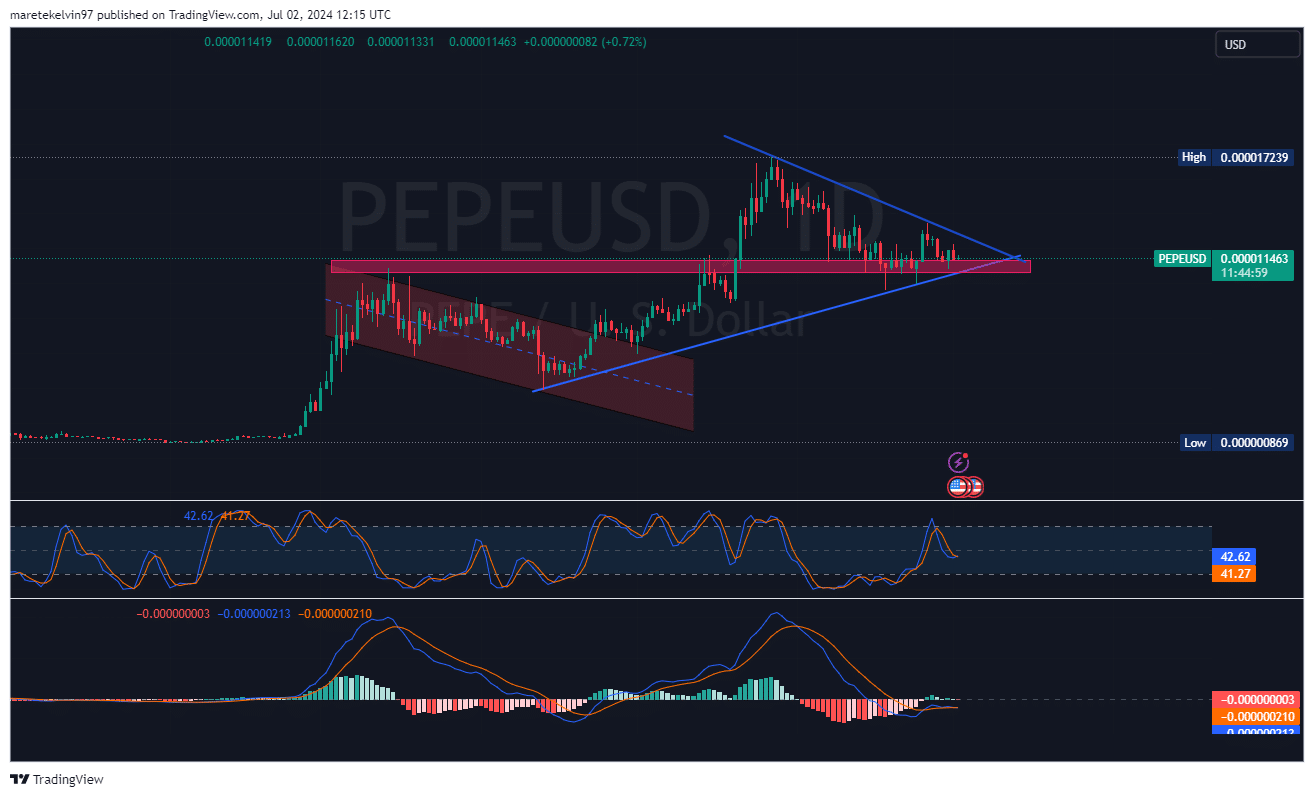
Source: TradingView
PEPE holder sentiment remains bullish
AMBCrypto’s look at IntoTheBlock’s “In/Out of the Money” data painted an optimistic picture of a potential breakout. Notably, 78.56% PEPE holders were in the money at press time.
Only 14.46% of addresses were “Out of the Money,” indicating limited selling pressure from underwater positions.
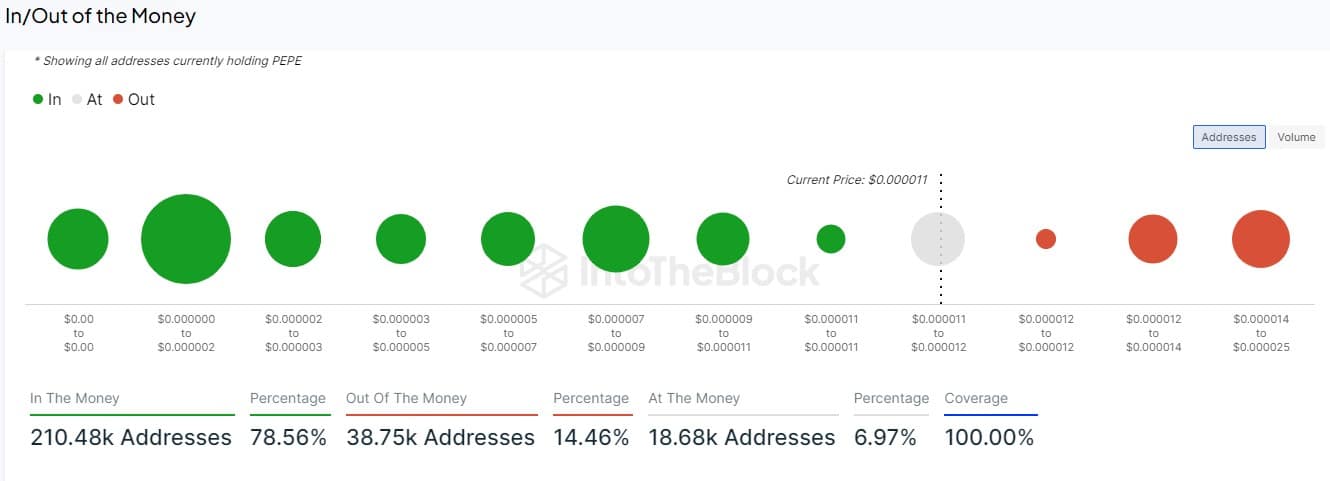
Source: IntoTheBlock
AMBCrypto’s analysis of the address activity IntoTheBlock data showed spikes in new and active addresses.
This increased number of active addresses often correlates with growing interest and potential price volatility.
The uptick in active addresses stood out, as it reached new high levels that have not been seen since April 2024.
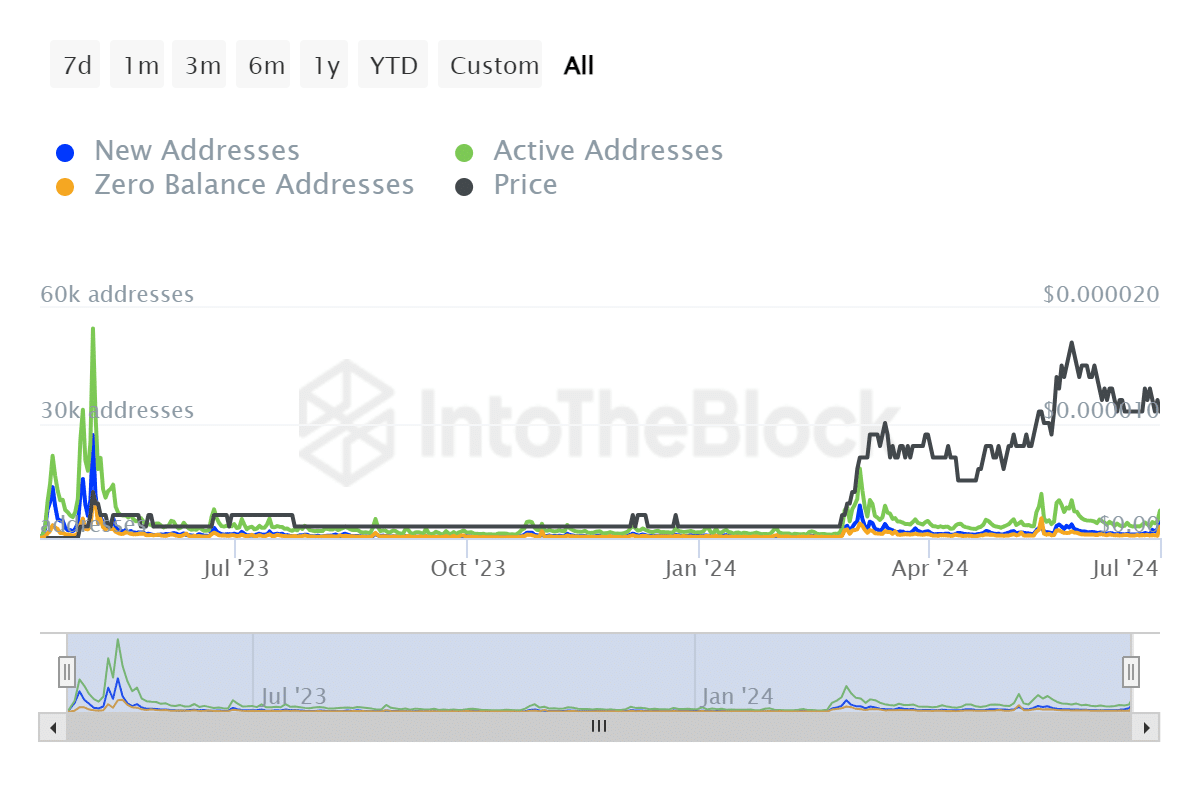
Source: IntoTheBlock
What tale do liquidations tell?
To add to the increasing active addresses, AMBCrypto further analysed the Coinglass liquidation heatmap, which showed concentrated liquidation levels between $0.00001164 and $0.00001180 over the last 24 hours.
This concentration suggested that investors were actively engaging within this price corridor, which in turn could potentially set up a breakout.
Despite the minimal price movements, the liquidation data points to underlying market tension. Investors appear to be positioning themselves for potential price action, with leveraged positions clustered around key levels.
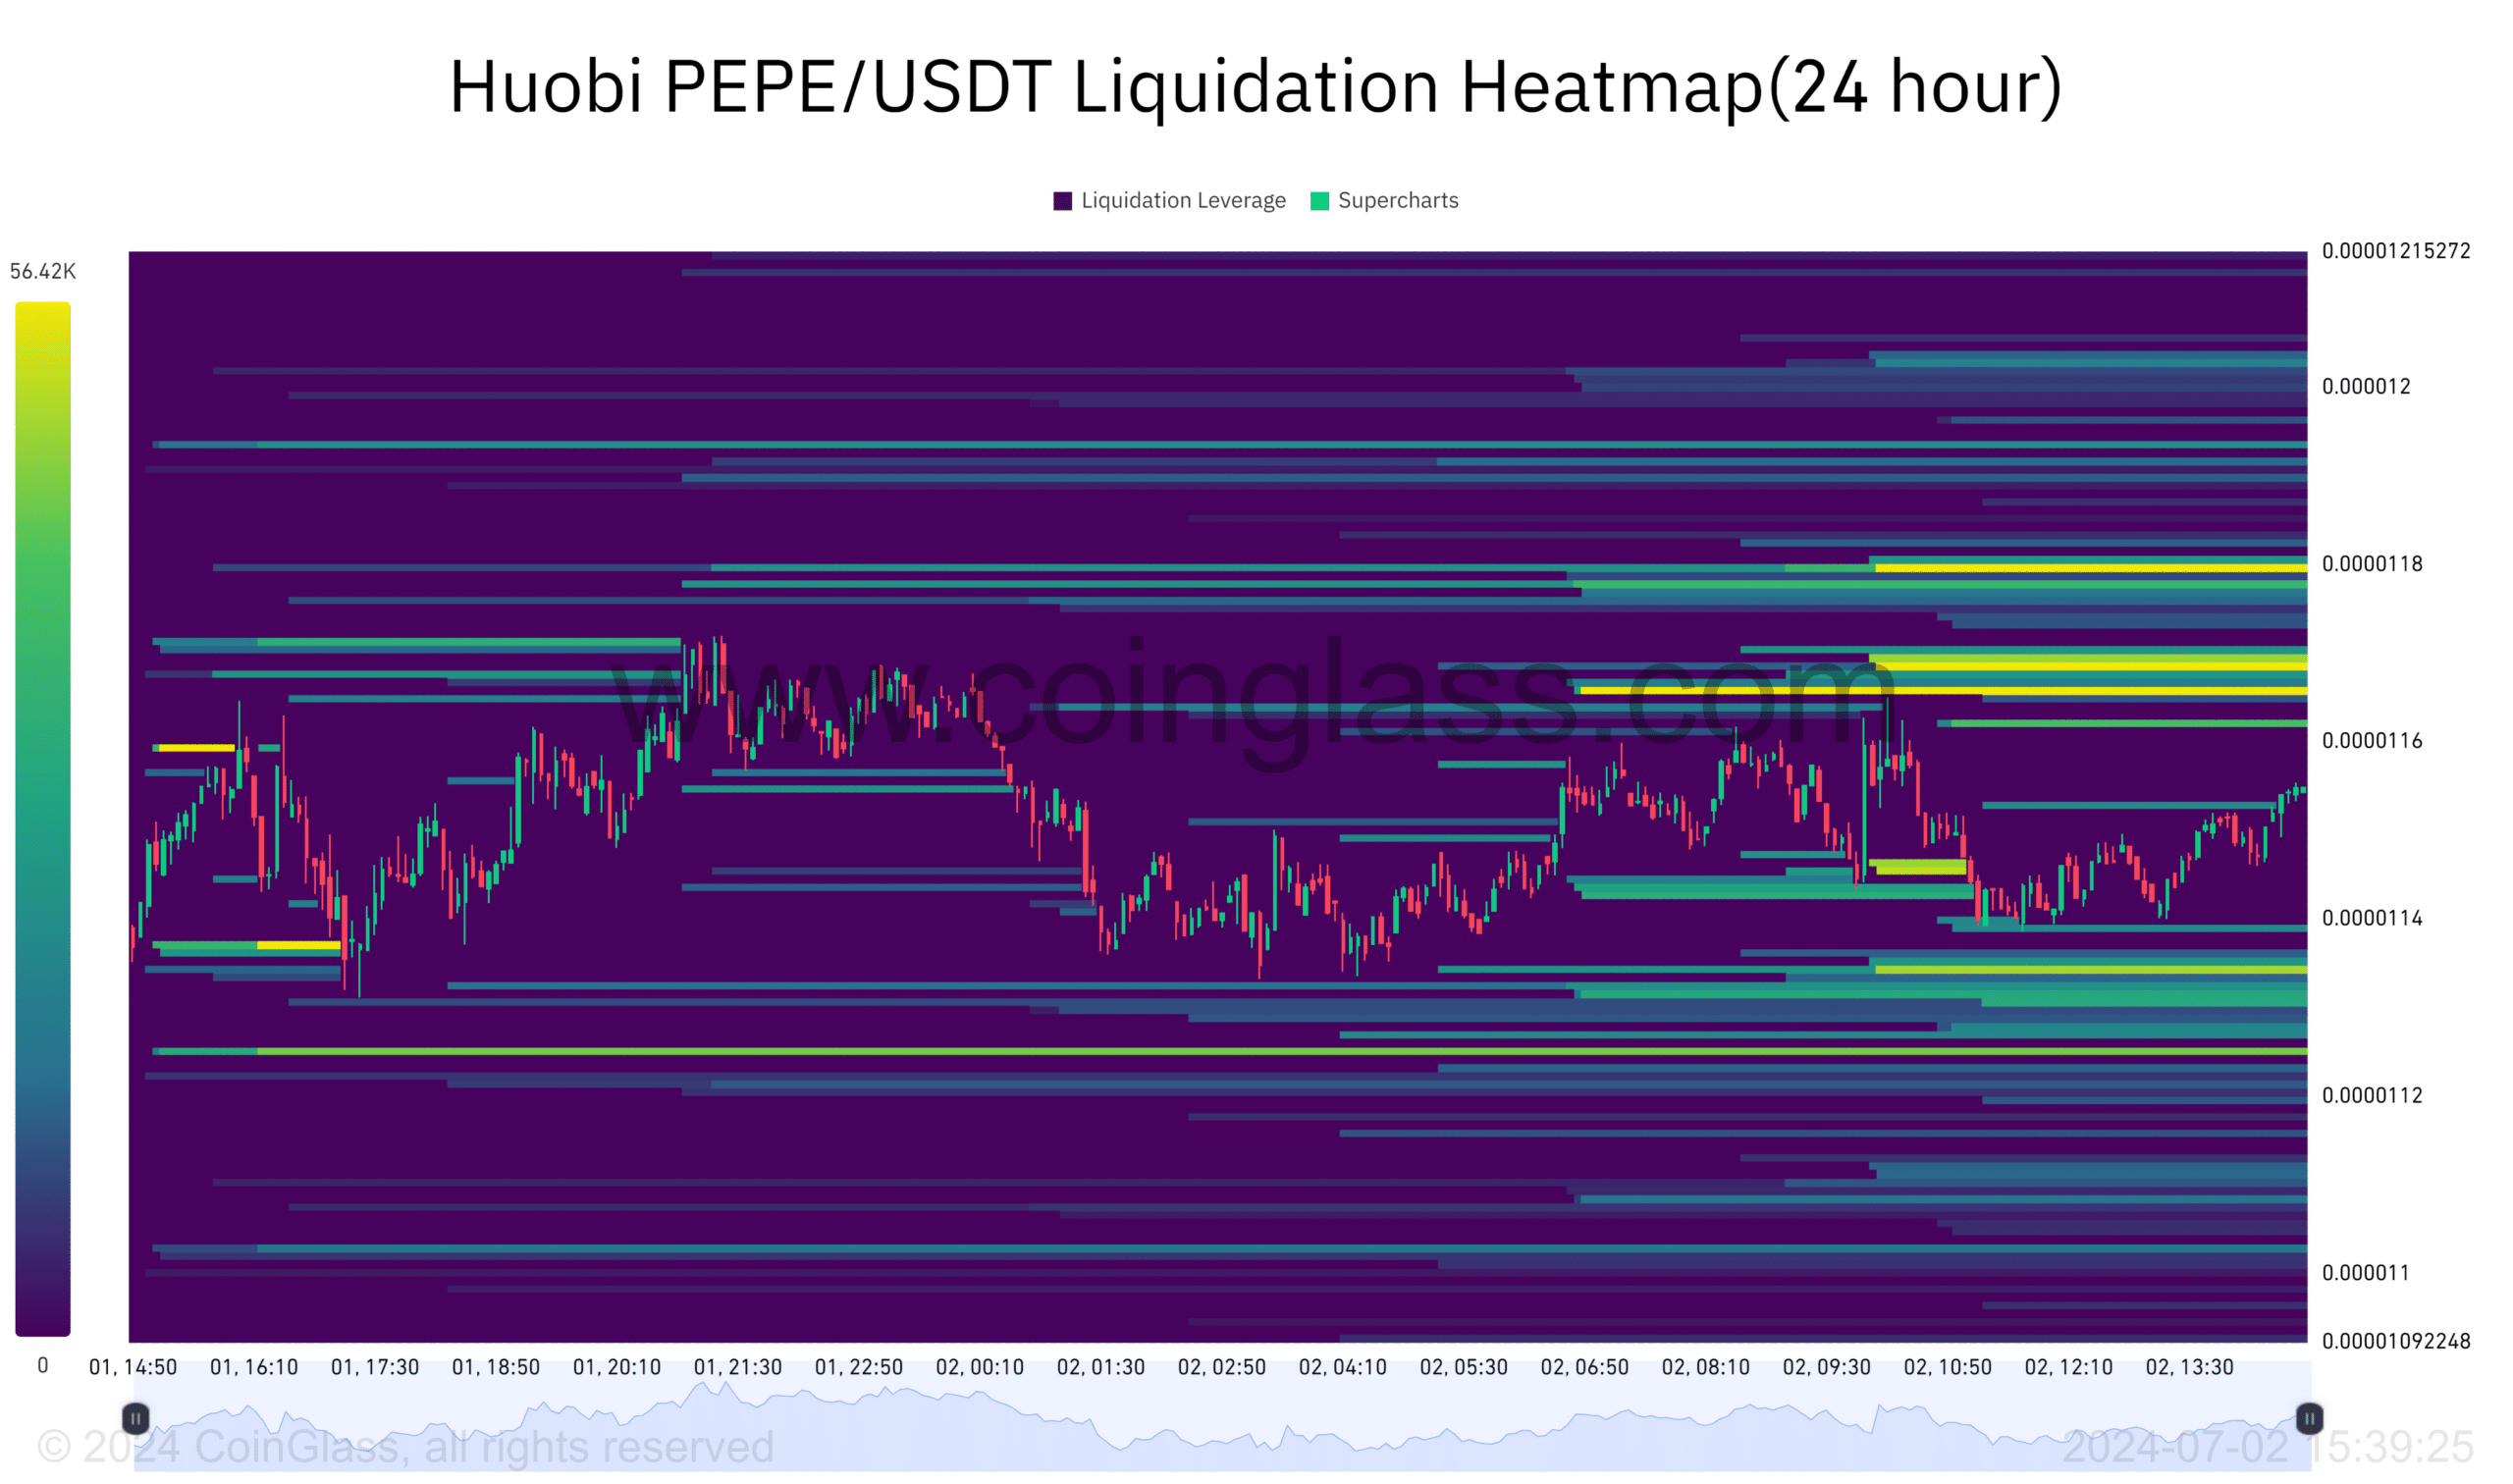
Source: Coinglass
Read Pepe’s [PEPE] Price Prediction 2024-25
The technical patterns and metrics suggested that a breakout was imminent, but only if PEPE accumulates enough momentum.
However, if the price breakdown happens below the key support level, further downsides are on cards.