
This metric isolates the cost basis of older UTXOs (unspent transaction outputs), offering insights into the behavior of long-term holders. These investors typically accumulate during bear markets and distribute in bull phases.
A rising long-term realized cap suggests sustains capital inflows and growing conviction, while a decline may point to profit-taking or weakening market sentiment.
Historically, Bitcoin has reacted sharply whenever this metric has approached key levels – Either launching new rallies or falling into consolidation.
What does the data say?
Source: Alphractal
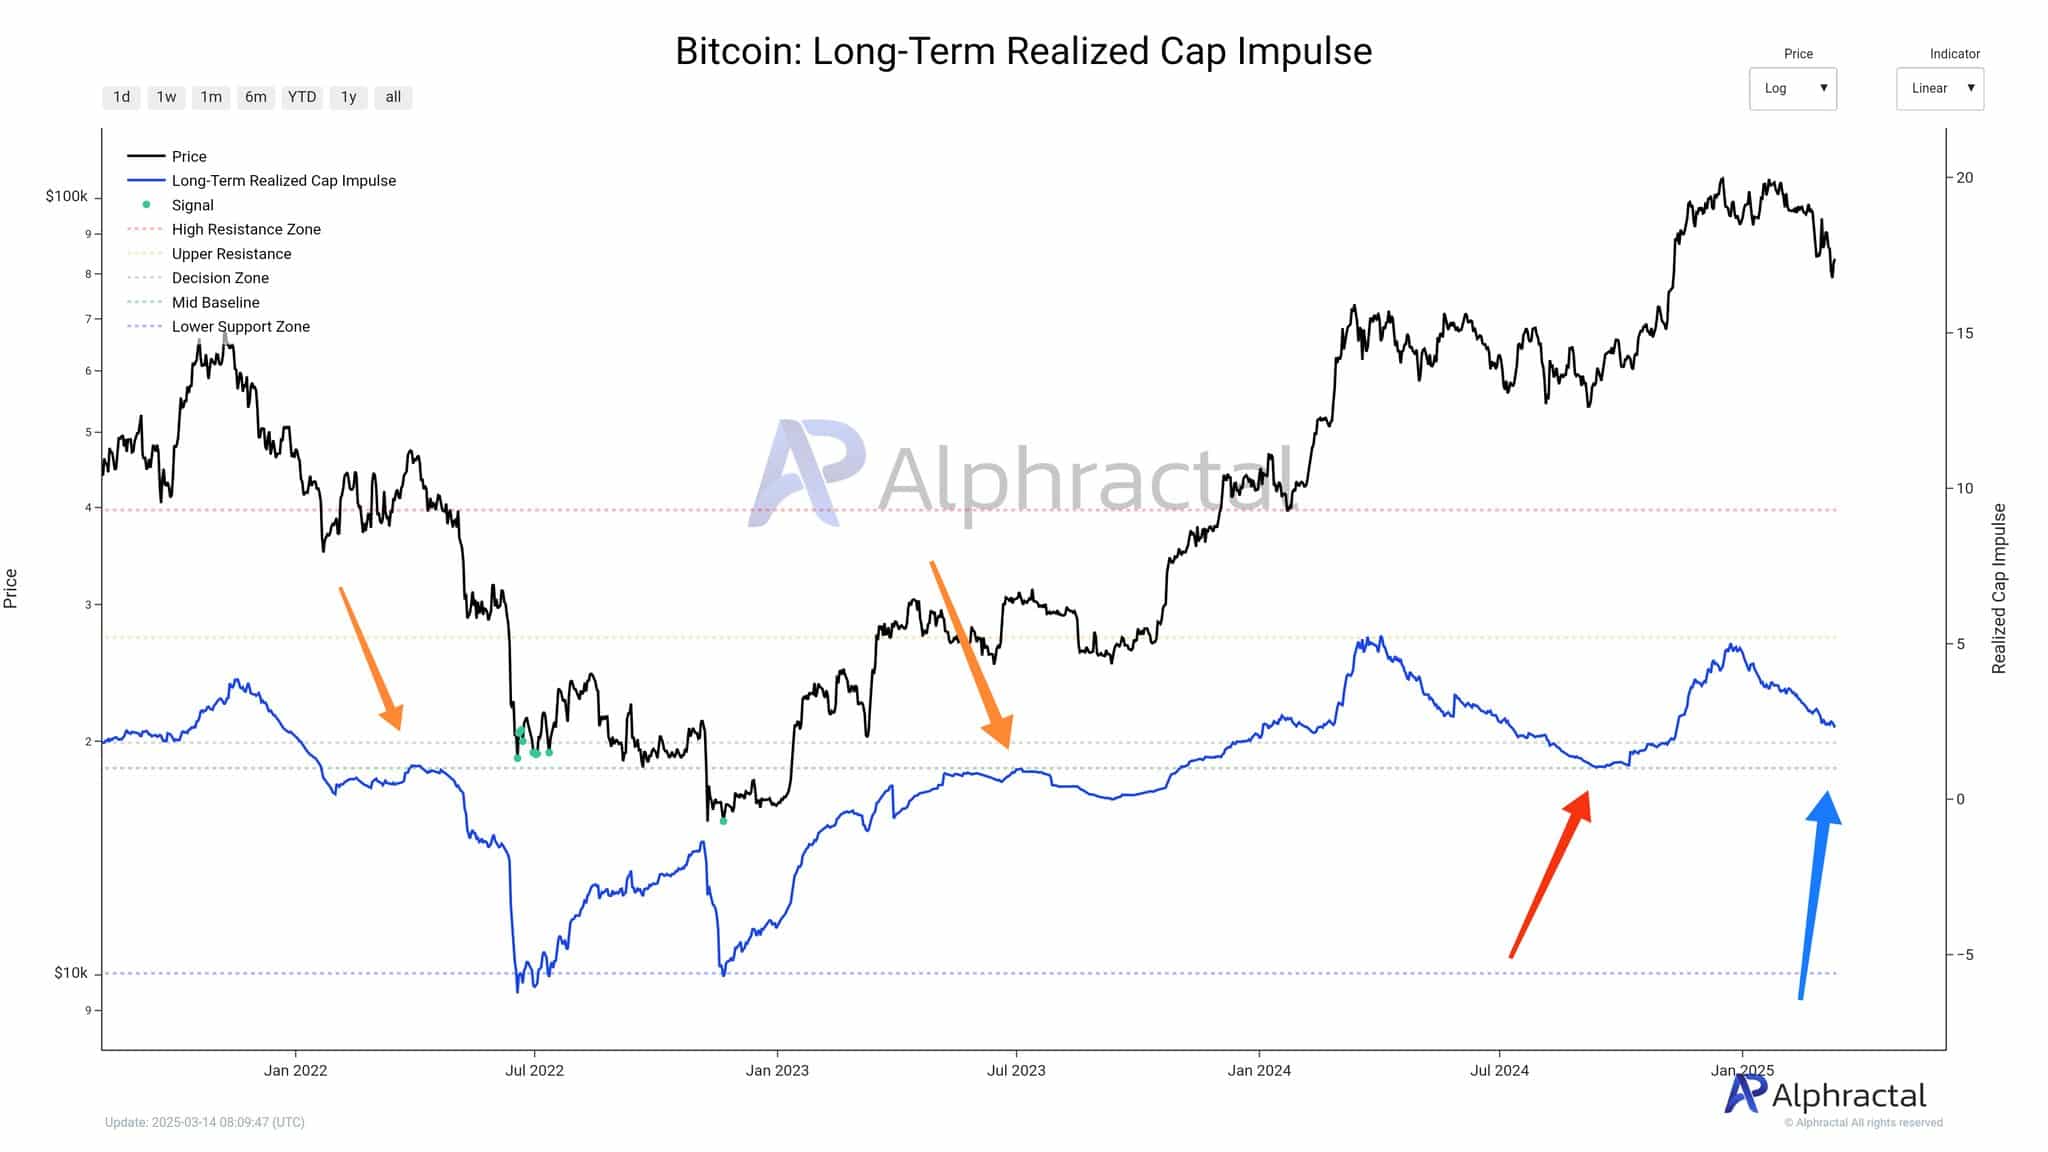
Latest data revealed a decline from local highs, with the metric drifting towards the mid-baseline. This cooling trend could indicate that the market may be entering a pause after months of bullish momentum.
Historically, a neutral or negative realized cap impulse has preceded consolidation phases – or, in some cases, market corrections. In the attached chart, the latest red arrow pointed to this risk, though a blue arrow hinted at the potential for a recovery.
Source: Alphractal
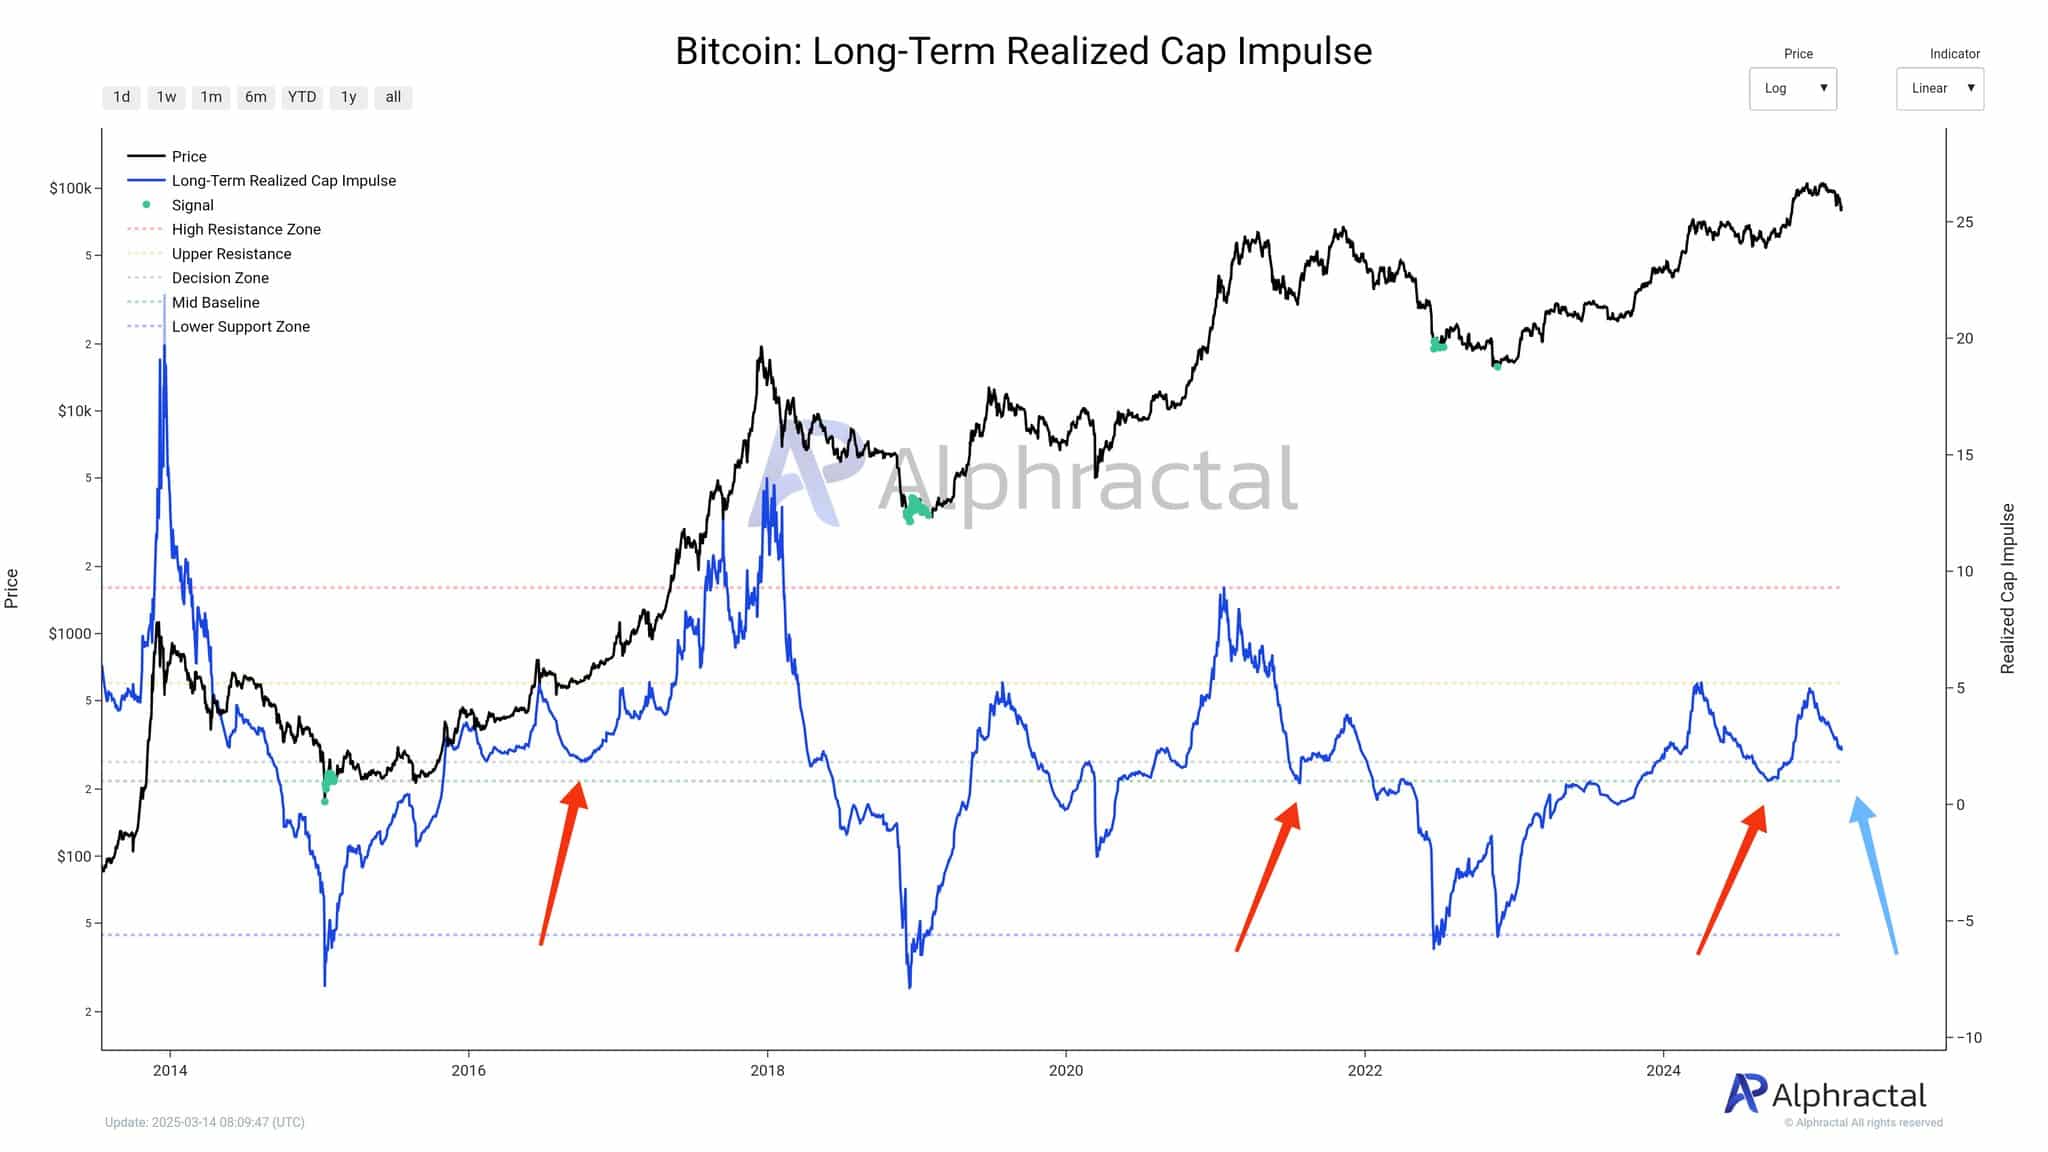
Notably, in both 2016 and 2020, dips in this metric were followed by renewed bullish momentum and eventual all-time highs. If this pattern holds, Bitcoin could soon shift into an accumulation phase ahead of another breakout.
Still, while on-chain signals remain cautiously optimistic, macro and market-specific factors will heavily influence the road ahead.
Bitcoin’s price outlook
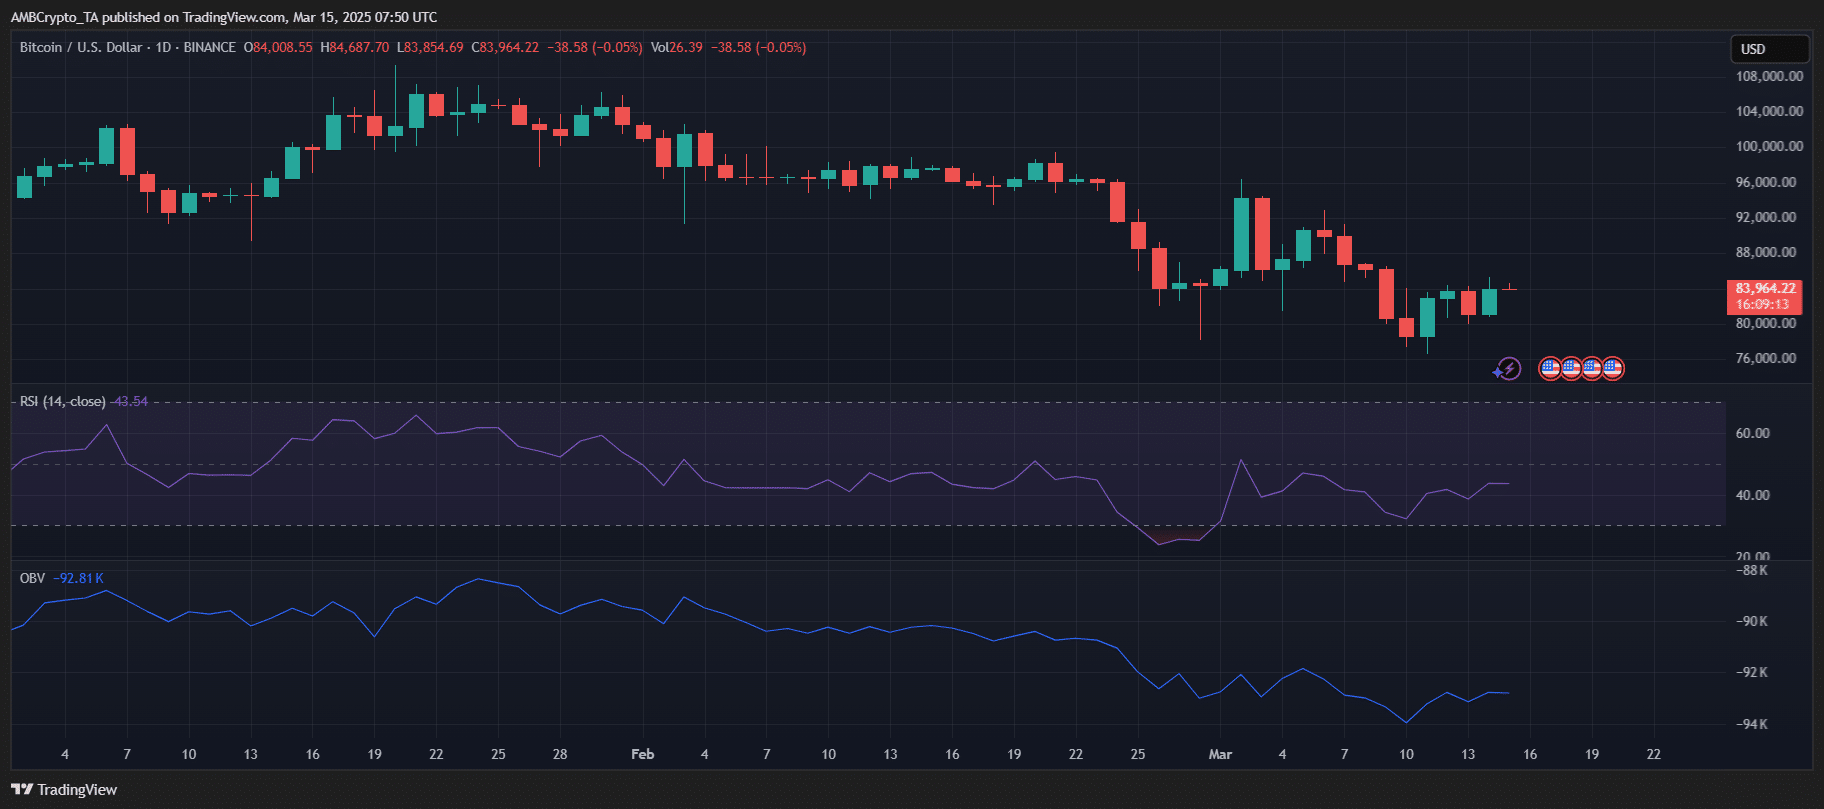
Source: TradingView