
- FLOKI formed a bullish technical pattern known as the cup and handle pattern – A sign of a rally
- A golden cross pattern surfaced on the chart too, with accumulation of the asset growing across the spot market
Floki [FLOKI] has shown a level of bullish sentiment in the market lately, with a rally of 2.42% gradually attempting to defy its previoius month’s drop of 12.27%.
In fact, several bullish indicators have surfaced on the chart, revealing that the current leg up could extend further as market participants continue to buy FLOKI.
Bullish pattern could be a rally launchpad
The press time formation of the cup and handle pattern on the chart seemed to be an indication of an incoming rally. Such a pattern typically precedes a major move to the upside.
According to this analysis, this rally could be a potential launchpad for major price gains of 24.82% to $0.00006711 from its press time price level.
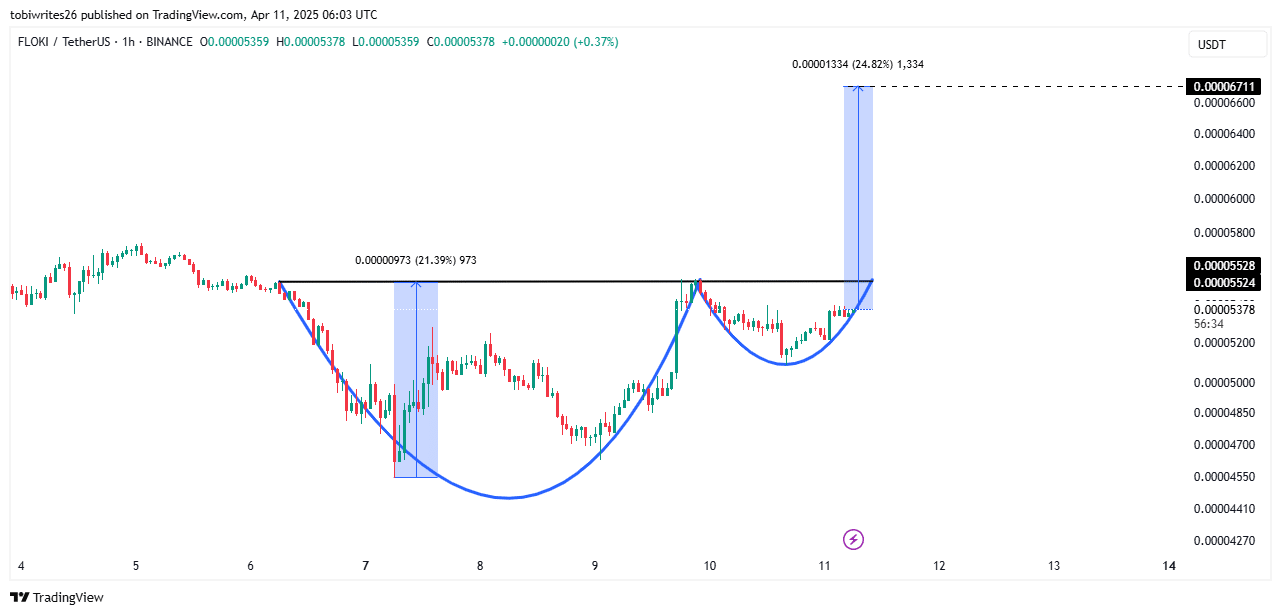
Source: TradingView
However, the rally would fully ignite once FLOKI breaches the black resistance line on the chart. Once it breaches the level, it could hit the target. Technical indicators pointed to a possible upside too. Two key tools—Moving Average (MA) Ribbon and Parabolic SAR—seemed to support this view.
The MA Ribbon includes multiple Simple Moving Averages (SMA) – 20, 50, 100, and 200. At the time of writing, it was reflecting a degree of bullish sentiment.
This outlook was further confirmed by a golden cross pattern. The short-term SMA 20 also crossed above the long-term SMA 200. Such a crossover means that short-term traders have been overpowering the long-term bearish trend.
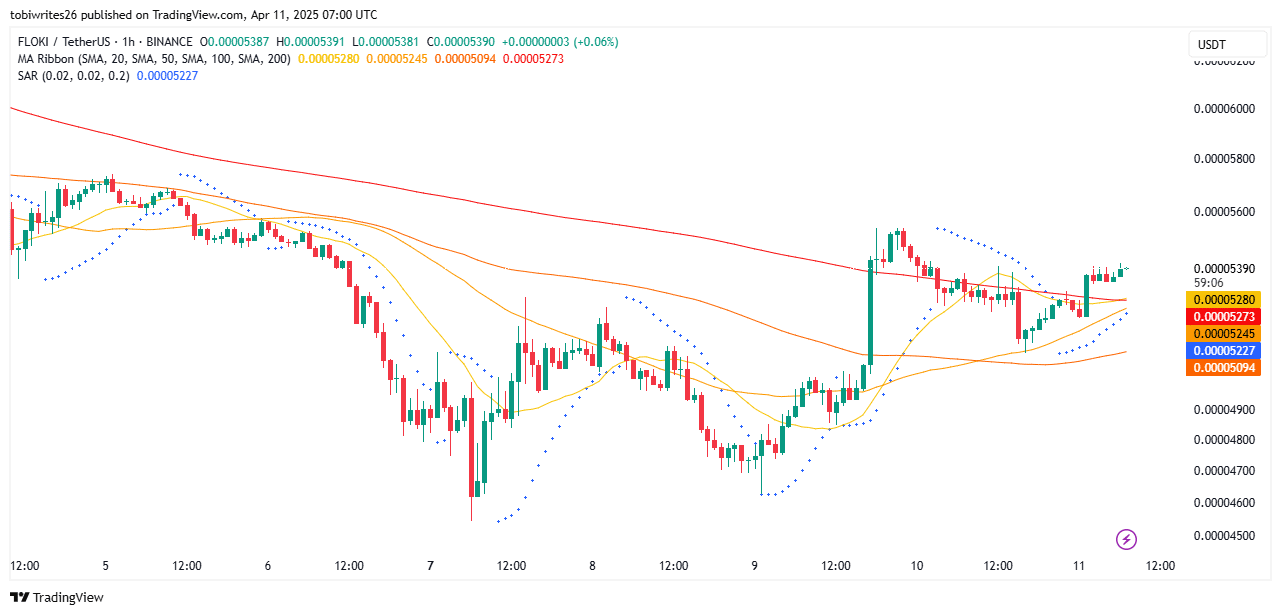
Source: TradingView
The Parabolic SAR also added to this bullish wave for FLOKI. This indicator uses dots to determine the trend.
This is the case when these dotted markers appear above the price. It means sellers are gaining strength in the market. On the contrary, when below the price, it means that buyers are in control.
A look at the chart highlighted that a series of dotted markers formed below FLOKI’s press time price action. This can be interpreted to hint at market confidence, with a further move to the upside possible too.
Strong buying sentiment across the market
Spot market traders over the past week have been accumulating the asset gradually, contributing to the press time price formation on the chart.
According to exchange netflows, which track the movement of an asset in and out of exchanges, traders in the spot market have purchased $502,000 worth of FLOKI. If this buying pattern continues, these trades might be setting the stage for a gradual supply squeeze.

Source: CoinGlass
Derivative traders have also been taking advantage of the bullish sentiment, placing long bets as buying volume surges.
The Taker Buy Sell ratio revealed a hike in buying activity, with a reading of 1.024. Any reading above 1 means there is more buying activity in the market, and that the asset tends to follow this path.
Overall, if market indicators and sentiment continue to stay within bullish territory, a possible price push to the upside is likely.