- ETH has declined by over 4% in the last 24 hours.
- A further decline could trigger panic sales from some holders.
Ethereum[ETH] has experienced a notable decline in the last 24 hours, erasing much of the gains accumulated over the past week. Data indicates that Ethereum has been under significant selling pressure, which could lead to further downward movement if the price fails to find consolidation at key levels.
Ethereum is down
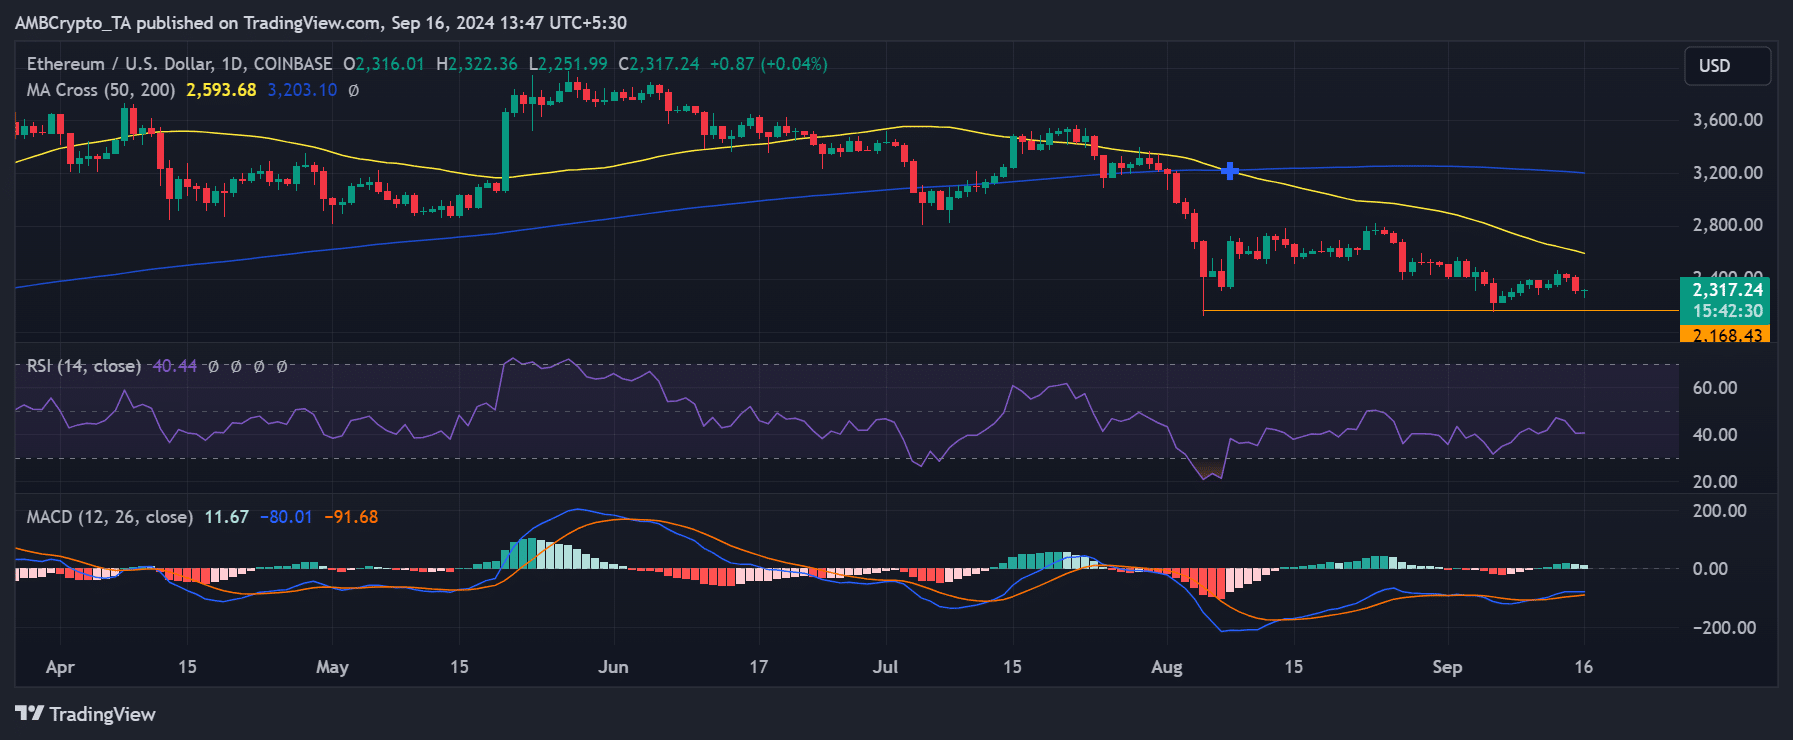
Analysis of Ethereum’s price trend on a daily chart revealed that it began the week with a significant decline, losing 4.21% by the close of trade on 14th September, bringing the price to around $2,316.
As of this writing, Ethereum continues its downward momentum, trading at approximately $2,300 with a less than 1% decline.

Source: TradingView
If Ethereum continues its current trend, it could test the next support level at $2,224, a level where it previously found support after similar declines. Should the downward pressure persist, the next key support is around $2,168, which could be a critical zone to watch.
Additionally, Ethereum remains in a bearish trend, as indicated by its Relative Strength Index (RSI), currently hovering around 40. This suggests ETH is edging closer to the oversold zone, signaling a potential weakness in buying momentum.
Ethereum sees more sell pressure
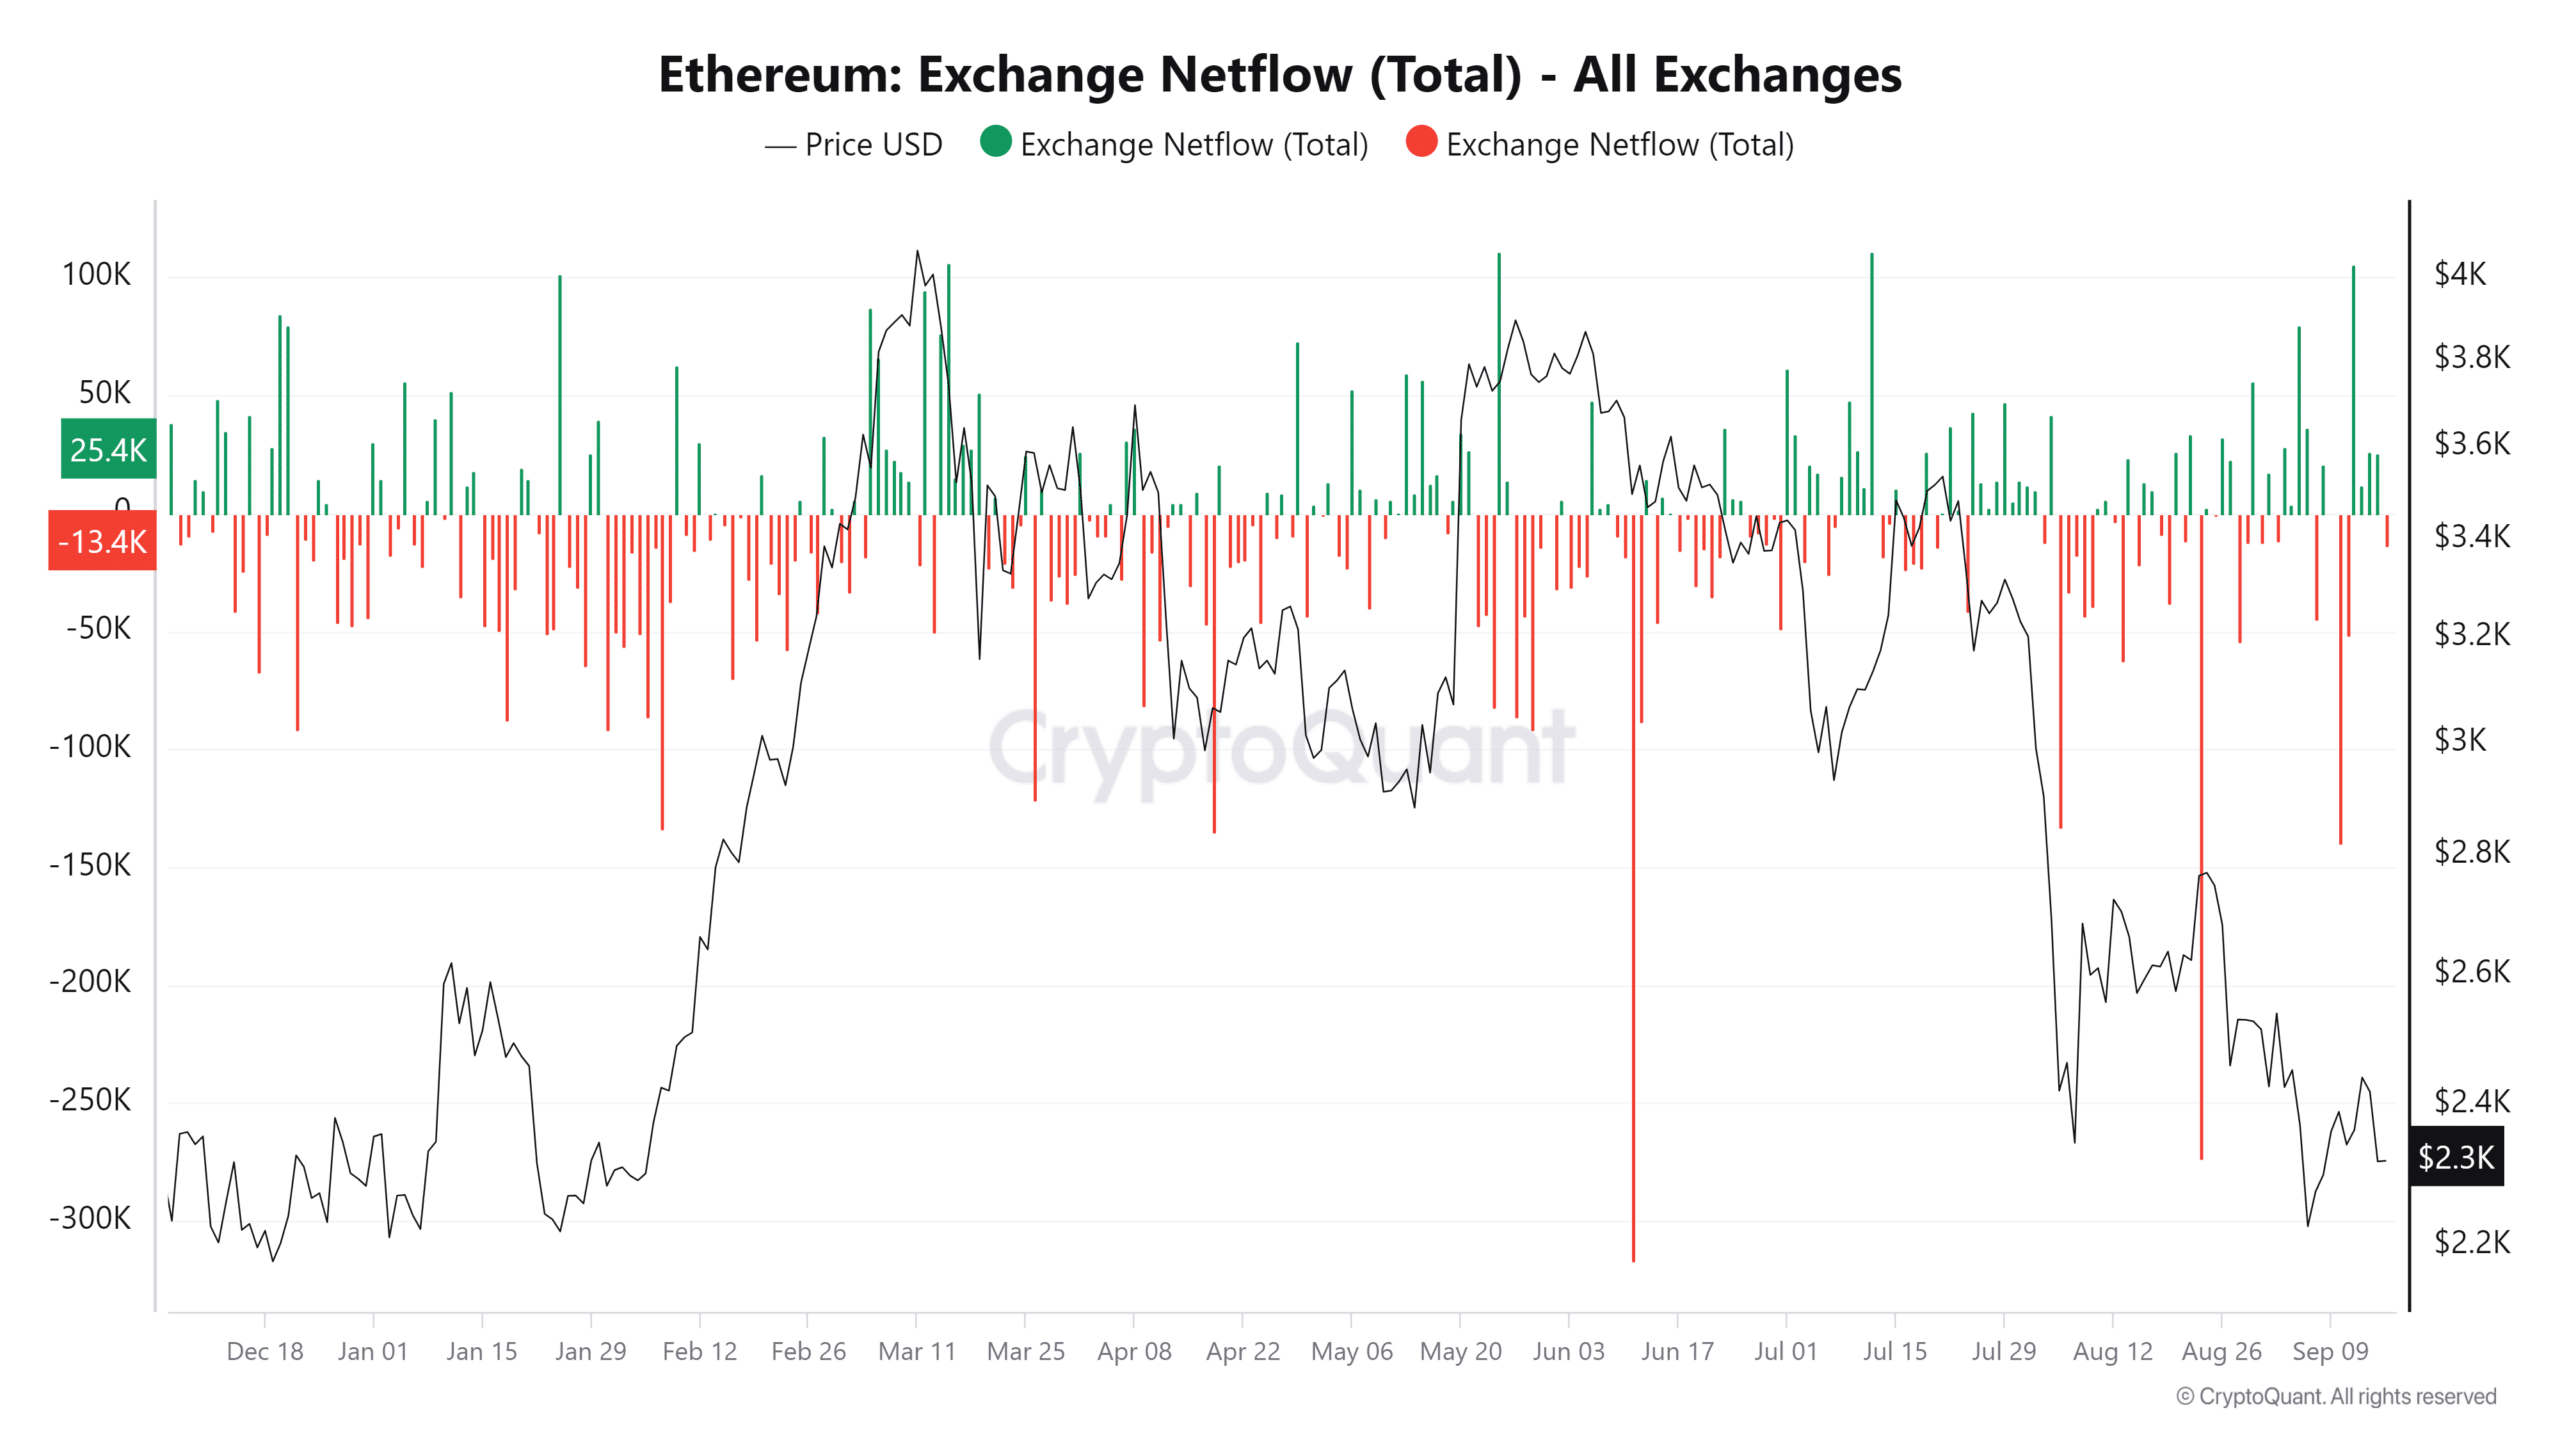
Analysis of Ethereum’s exchange netflow over the past five days shows a consistent pattern of positive netflows. The positive flow started with a significant inflow of over 105,000 ETH on 12th September.
The flow indicates that more ETH has been sent to exchanges during this period, which is typically associated with increased selling pressure.


Source: CryptoQuant
The consistent positive netflow signals that traders are moving ETH to exchanges, possibly to liquidate or sell their holdings. This sell pressure is a major factor behind Ethereum’s inability to sustain its recent price rally.
Furthermore, trade volume analysis in the last trading session showed a decline to around $7 billion, reflecting reduced trading activity. The comparison of the volume trend with the price trend suggests that sell volume has been outweighing buy volume.
As of this writing, per Santiment data, the trade volume has surged to over $14 billion, doubling from the previous session. However, whether buyers or sellers drive the increased volume and which side will dominate is still being determined.
Key holders hold clues to the next price trend
According to data from IntoTheBlock, over 1.7 million addresses currently hold Ethereum around the current price level, collectively holding nearly 53 million ETH. This indicates that the current price zone serves as a critical support level.
As of this writing, these holders are at a break-even point, meaning they are neither in profit nor at a loss.
Read Ethereum (ETH) Price Prediction 2024-25
If Ethereum’s price drops below this key level, these addresses could panic sell to avoid losses. Given the substantial volume of 53 million ETH, any widespread sell-off could lead to a significant price decline.
However, if ETH can maintain this price range, it might stave off further declines.

