
- SOL’s pattern within a descending triangle suggested an impending bullish trend.
- A bullish crossover, combined with increasing interest from retail investors, is likely to ignite this rally.
Over the past week, Solana [SOL] has shown only a slight price increase of 0.8%. However, current analyses predicted a notable rally ahead, with potential targets reaching as high as $175.
Multiple bullish patterns and converging bullish signals have been identified, with insights provided by AMBCrypto on these developments.
Descending triangle signals potential rally for SOL
On the 4-hour chart, SOL traded within a descending triangle, a pattern often indicative of buyer accumulation preparing to propel the price forward.
Should a rally initiate, it typically extends to the peak of this pattern. For SOL, this aligned with the $163.70 level.
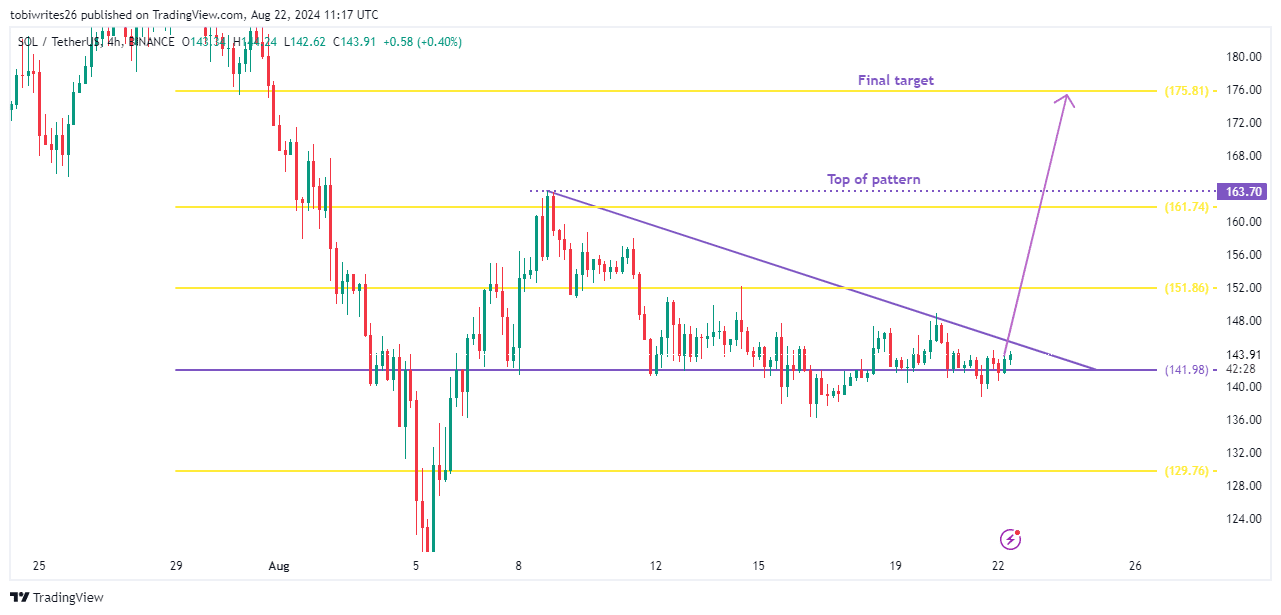
Source: TradingView
Using the Fibonacci tool for further analysis, a breakthrough above $163.70 with a daily candle close suggested that SOL’s next target could be the $175.81 mark.
However, the realization of this rally depended on the presence of additional market catalysts.
Analysis from AMBCrypto has identified several key confluences, indicating that a rally might be imminent.
Golden cross could propel SOL toward $175
A ‘golden cross’ has formed as the MACD line (blue) at press time, as the negative 0.14 crossed above the Signal line (red) at negative 0.15.
This formation often precipitates a rise in trading volume and price movement in the same direction.
An event such as this is closely watched by traders for its potential to catalyze significant market movements, which tend to influence more traders to buy as well.
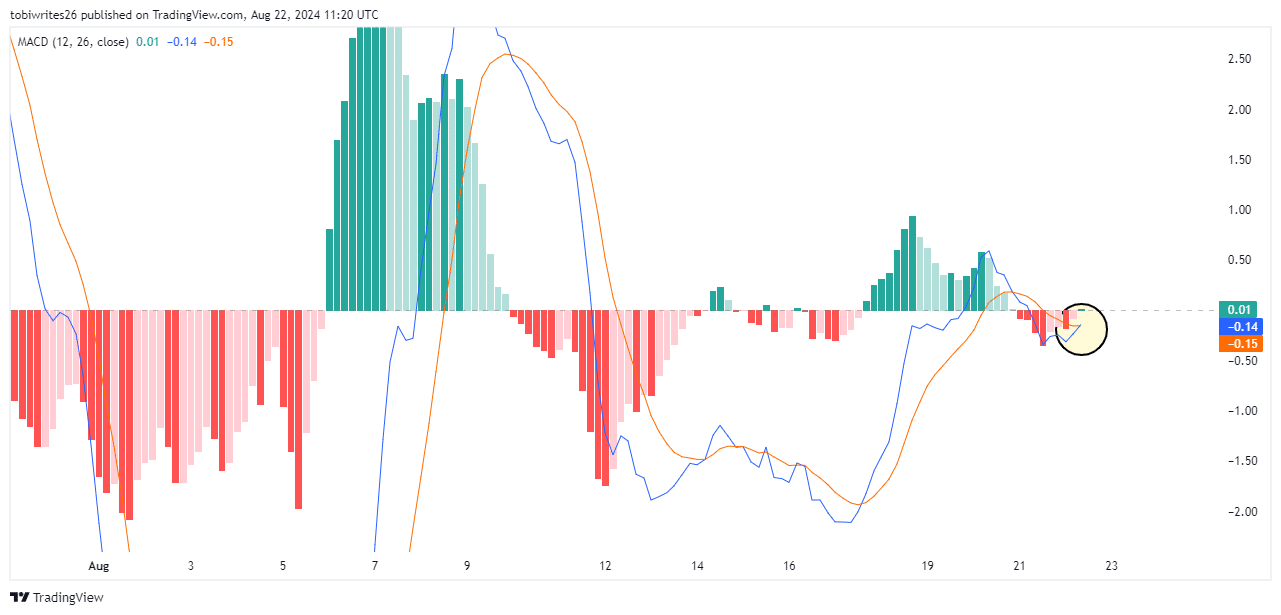
Source: TradingView
The MACD, or Moving Average Convergence Divergence, uses the 12 and 26 EMAs to track an asset’s price momentum, providing insights into potential buy or sell opportunities through these averages.
In the current scenario, the MACD indicated a bullish trend, suggesting a strong upward momentum for SOL.
This bullish trend, highlighted by the golden cross, added to the growing narrative that SOL’s price could escalate further, supported by increased investor interest and market activity.
Retail traders take a front seat
Retail traders play an important role in fueling market rallies by actively participating and pushing prices upward. Their impact is evident in two key metrics: open interest and the OI-Weighted Funding Rate.
The increase in Open Interest signaled that new money was entering the market, reflecting strong investor interest and expectations for future price rises.
Similarly, a positive OI-Weighted Funding Rate indicated that traders in long positions (anticipating price increases) were compensating those in short positions more heavily.
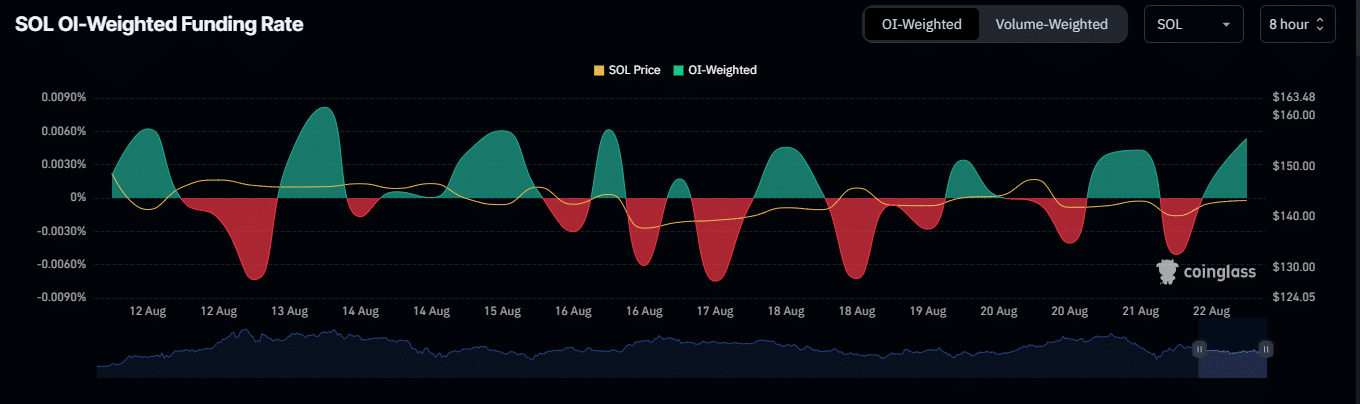
Source: Coinglass
Both the Open Interest and OI-Weighted Funding Rates were positive at the time of writing. This is good for driving SOL’s prices higher, possibly to the $176 zone, as marked by the Fibonacci line earlier.
Realistic or not, here’s SOL’s market cap in BTC’s terms
Around four hours before press time, there has been a significant market shake-up, with liquidations of over $134.20k, primarily affecting short traders who have absorbed $133.77k of this.
This indicated that retail traders were successfully driving prices higher, forcing traders betting against SOL to face losses.