- Chainlink formed a double bottom at press time.
- LINK whales were buying more tokens.
Chainlink [LINK] stands out as a cryptocurrency to watch, boasting a market cap exceeding $6.4 billion, ranking it 14th on CoinMarketCap.
Recent price movements in the LINK/USDT pair have started to show encouraging signs for traders eyeing both long-term and short-term gains.
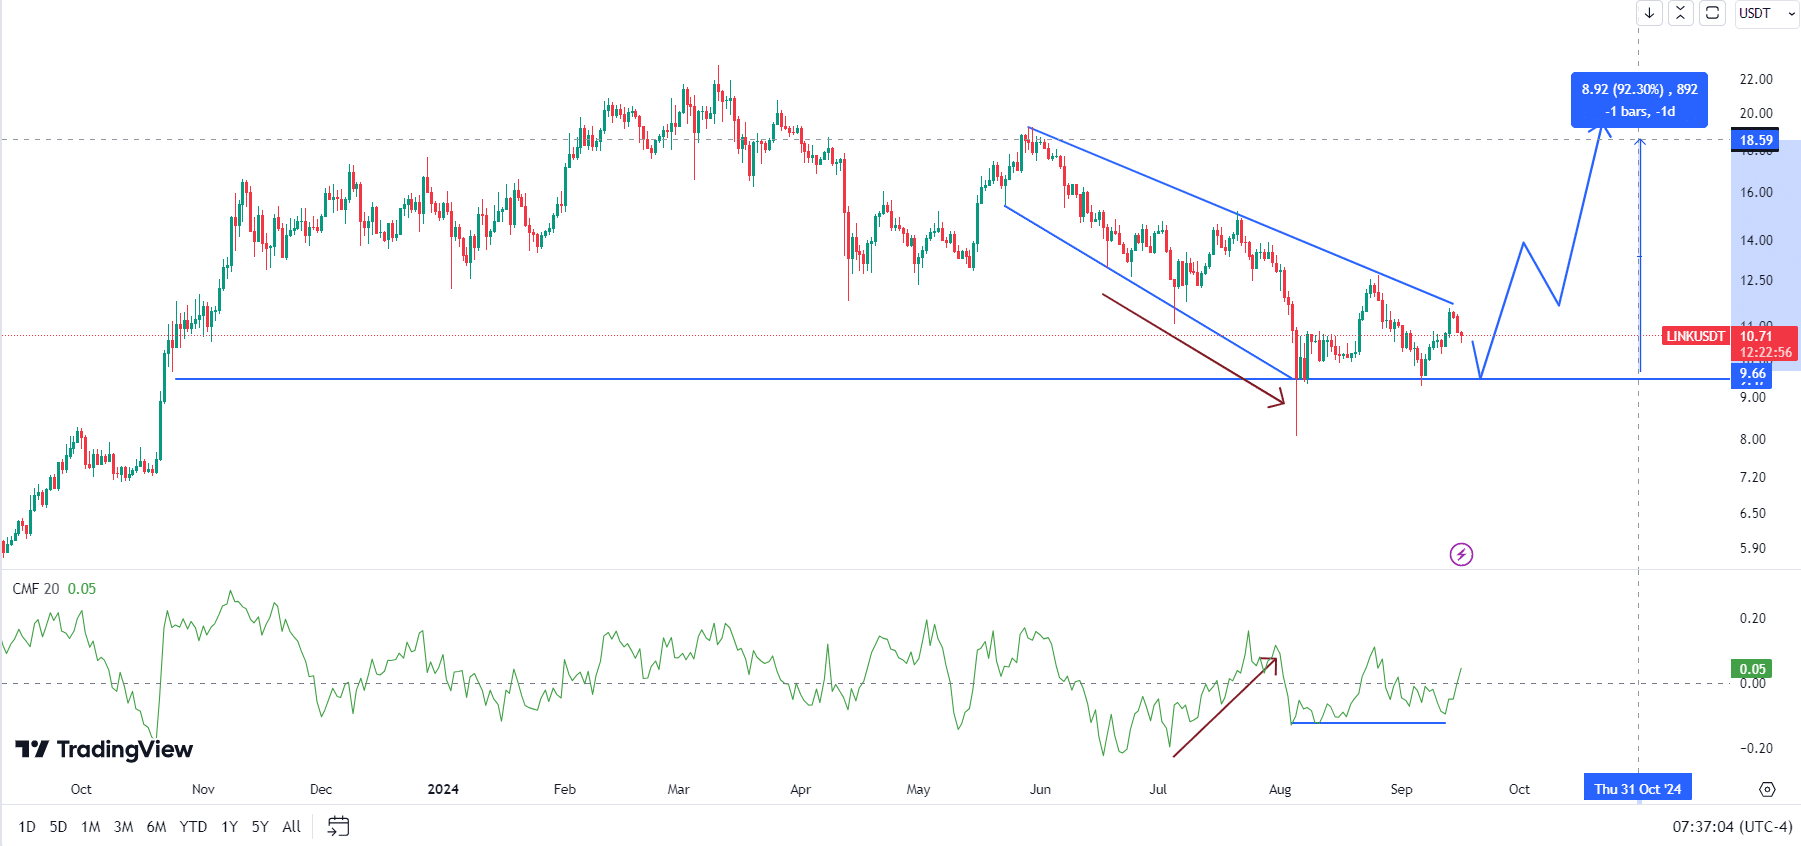
On the daily time frame, Chainlink’s price has formed crucial patterns, including a broadening wedge.
The support zone around $9.5 has emerged as a strong floor, reinforced by a double bottom pattern with potential for triple touches, which often signals a reversal to the upside.
This level is becoming increasingly important for LINK’s price as it pulls back toward this zone.

Source: TradingView
A breakout above the upper trendline of the wedge could indicate further upward momentum if prices bounce from the $9.5 support level.
Moreover, the Chaikin Money Flow (CMF) indicator was positive, suggesting buying pressure, which aligned with a potential price rise.
The divergence between the declining price action and the rising CMF typically signals a reversal could be on the horizon.
LINK balance by holdings
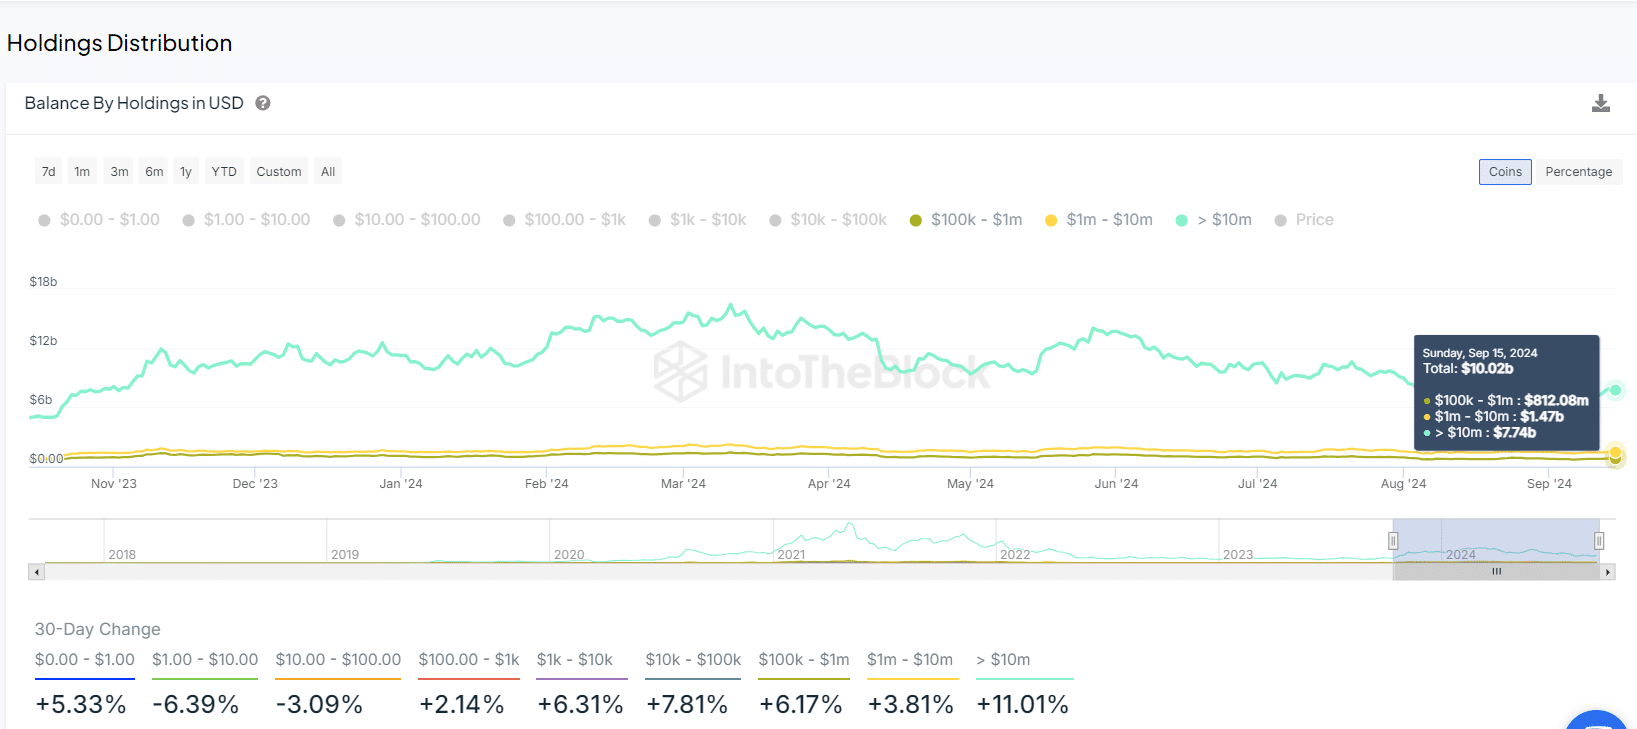
Another key aspect to watch is the distribution of Chainlink holdings, which further supported a bullish outlook.
The 30-day change in LINK balances showed strength across different holding categories, from those holding $100 LINK tokens to those holding over $10 million worth of LINK.


Source: IntoTheBlock
Notably, whales—key influencers of price movement—have increased their holdings. Addresses holding more than $10 million LINK have seen their balances rise by 11%, bringing the total to $7.74 billion.
Those with over $1 million worth of LINK have also seen their balances increase, now totaling $1.47 billion. The steady accumulation by large holders underscores the growing interest in LINK.
Liquidation levels
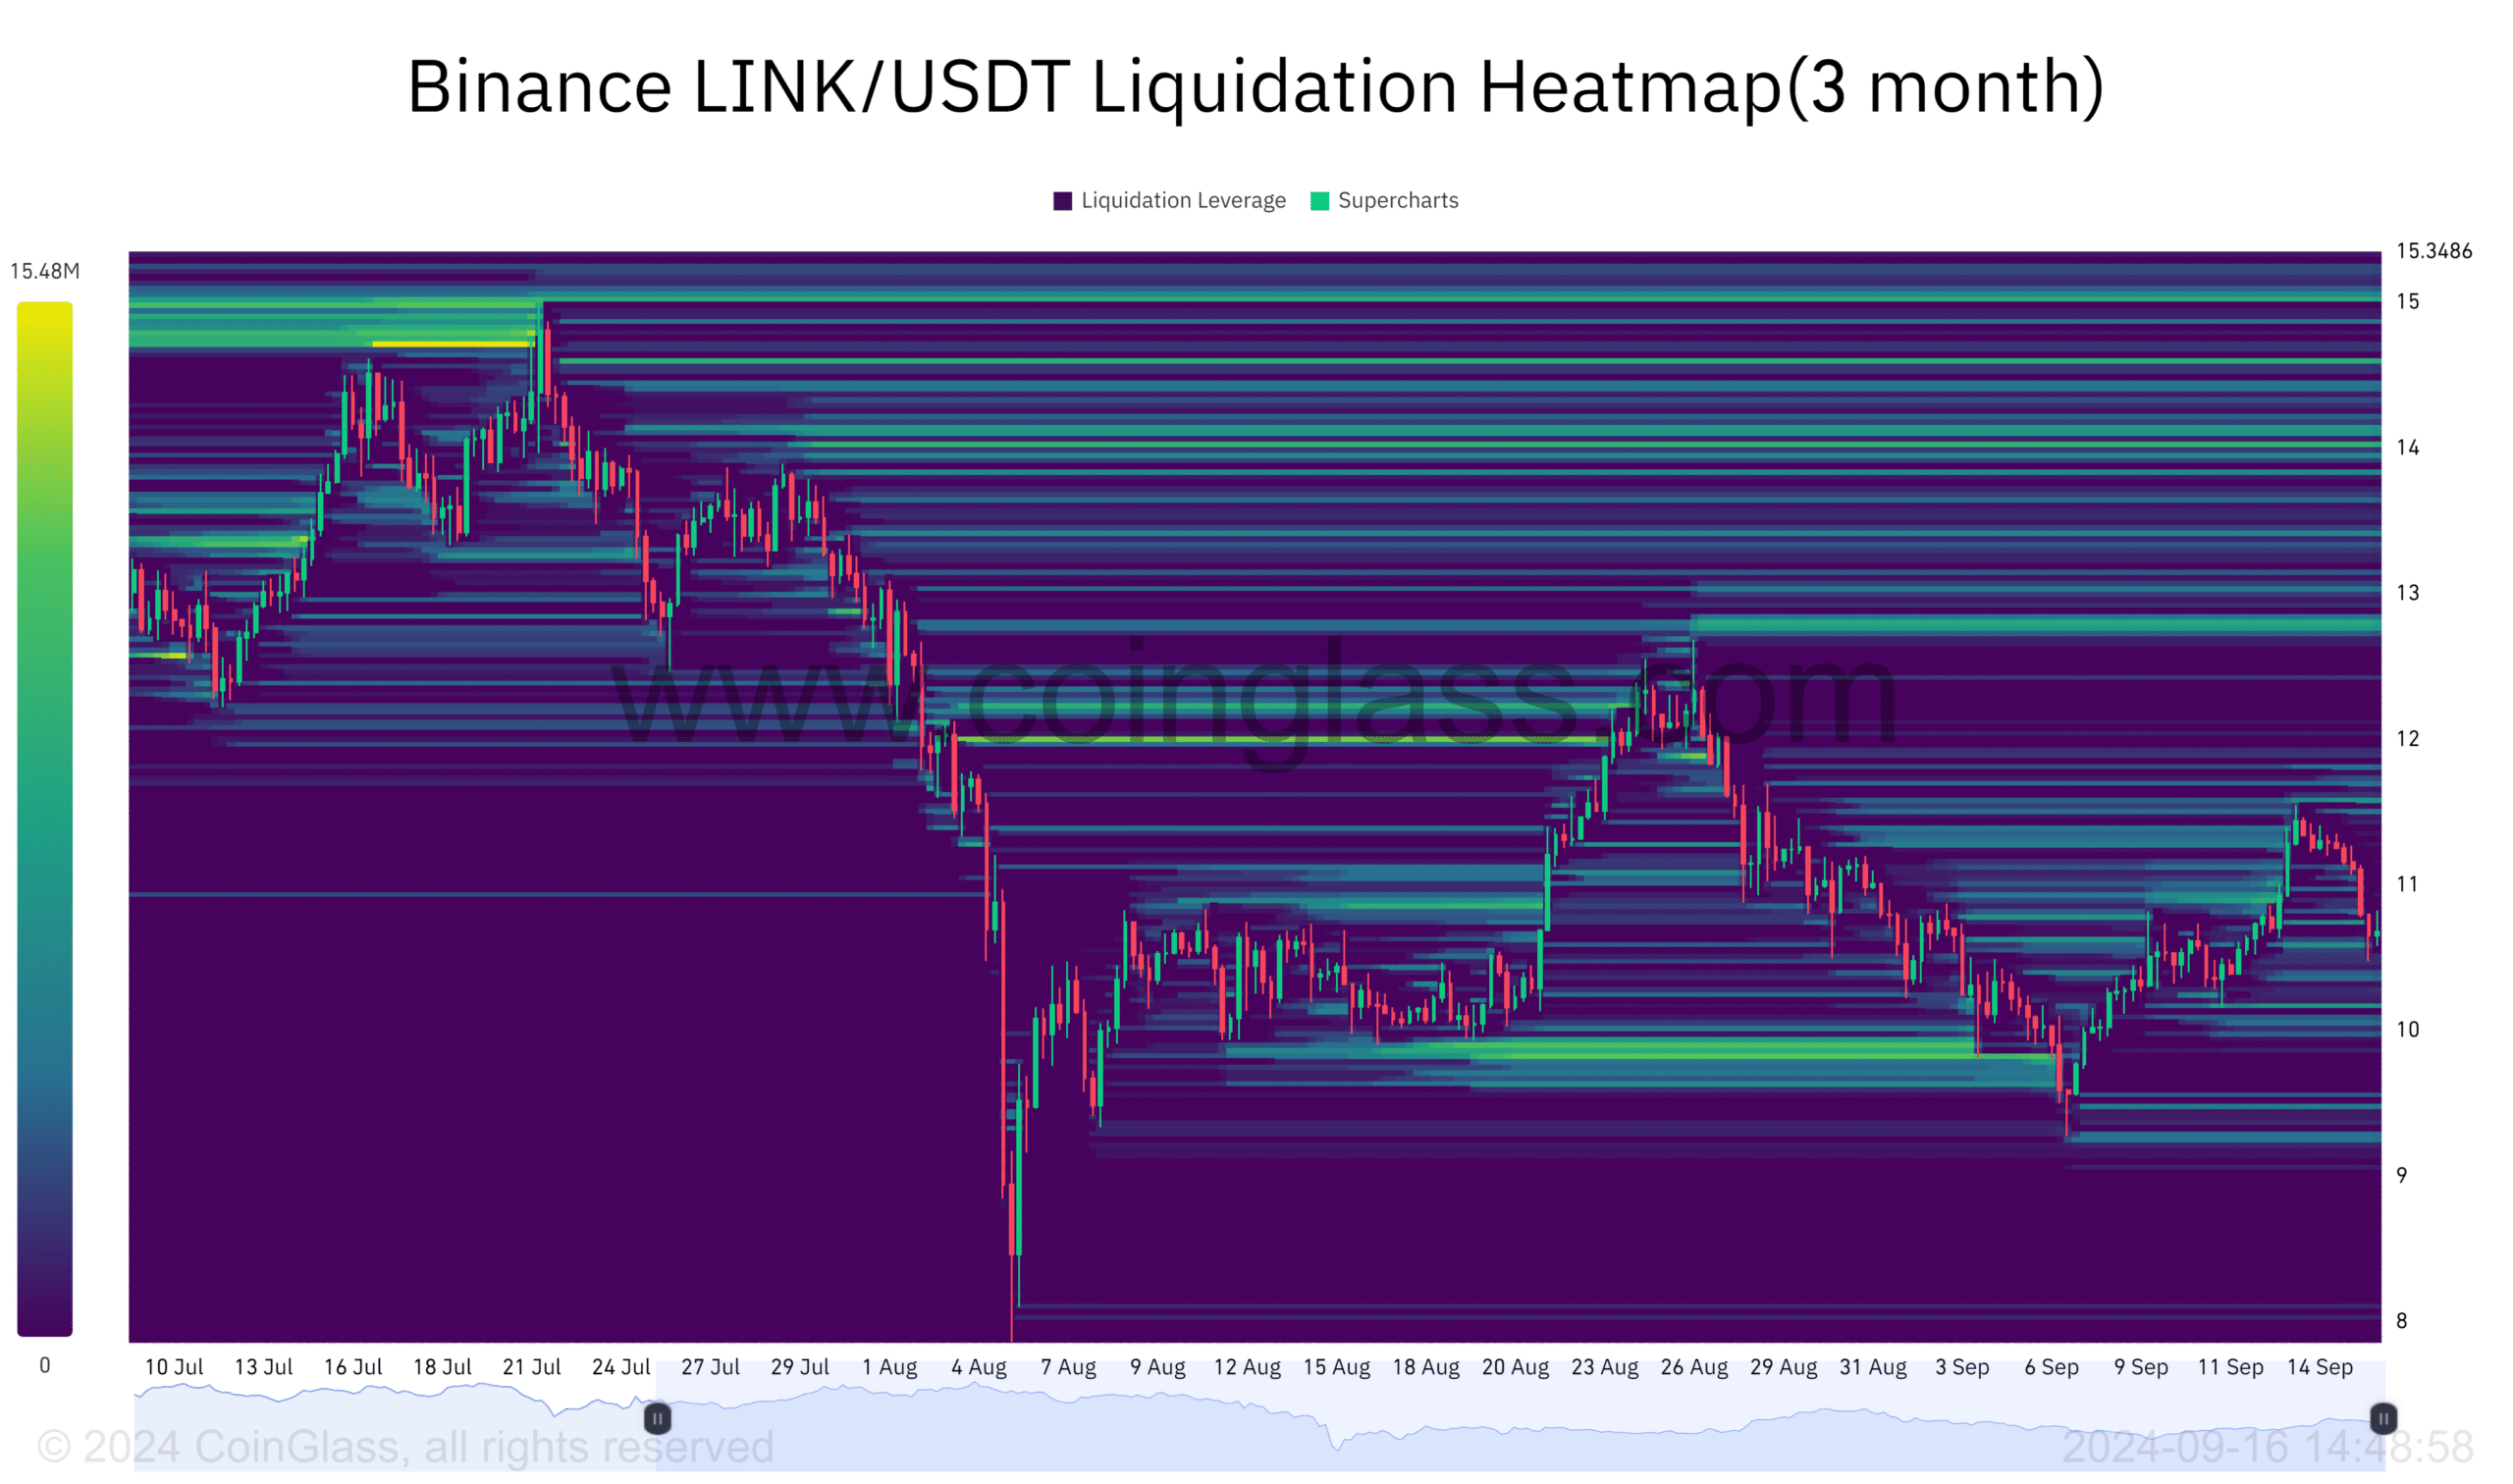
Liquidity levels also play a crucial role in LINK’s price action. Price often moves from zones of low liquidity to higher liquidity, and the Binance liquidation heatmap reflected this pattern.
The LINK/USDT pair recently cleared the liquidity clusters around the $9.89 level, where $9.77 million was swept, and price has since stayed away from that zone.
This indicates a likely move toward the next liquidity target, sitting above $12.81.
Traders may consider this level as a short-term target, with potential gains if the price advances toward higher liquidity areas, possibly reaching levels above $14.04.

Source: Coinglass
LINK market sentiment
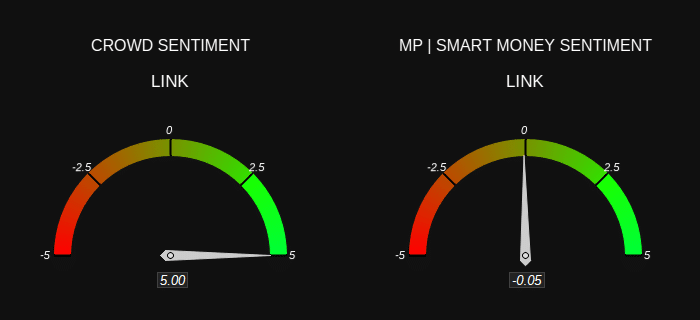
Lastly, market sentiment for Chainlink revealed a contrast between retail traders (CROWD) and institutional players (SmartMoney).
The crowd is notably bullish, while Smart Money is slightly bearish. However, the Smart Money bearish value is weak at -0.05, compared to the strong bullish sentiment of 5 for retail traders.

Source: Market Prophit
Read Chainlink’s [LINK] Price Prediction 2024–2025
Overall, the bias leans toward a bullish outlook, though market dynamics will ultimately dictate LINK’s next move.
This combination of technical patterns, liquidity dynamics, and market sentiment suggests that LINK’s price could move higher, positioning it as an attractive asset in the coming months.

