- ATOM crypto was up 6% in a day, with the price chart showing a break of the descending trendline.
- Its reaction at the $5 zone could determine its potential to continue trending higher.
Cosmos [ATOM] achieved a 6% increase in a day as it successfully breached the declining trendline that appeared on its daily chart.
If bullish momentum maintains its pace, ATOM could continue trending higher as it did the last two days.
ATOM came dangerously close to the $5 resistance, which was essential to be broken for a bullish confirmation.
ATOM’s price exceeding $5 and establishing long-term position above current levels could provide potential for a rally, which could reach new resistance barriers.
A failure to break and hold prices above $5 could make the bullish setup pointless and result in price rejection that could trigger market decline.
A price movement to $4.30 level may signal ATOM’s weakness, which could trigger lower support areas near $4.

Source: Trading View
The MACD indicator displayed a weak bullish orientation from its histogram that was slightly bearish from bullish.
The proximity of MACD to its signal lines indicated a possibility of market stabilization before emerging with a distinct trend pattern.
When ATOM exceeded the descending trendline it showed an evolving market momentum.
Price movement after the current juncture could probably depend on the behavior of Cosmos, as it trades between significant levels at $4.30 and $5.
ATOM’s liquidation levels
More analysis showed the heatmap from Binance revealed high concentration at the $4.87 level, accompanied by a liquidation leverage of $233.23K.
These zones of high concentration of liquidation activities signified an important area of interest.
The daily gains created larger liquidations in the regions around $4.87 and $5 thus suggesting price resistance possibilities.
Subsequently, long liquidations zones formed at $4.68 and $4.57 prompting key support levels.
Long liquidations would likely occur if ATOM failed to maintain positions above these resistance levels, which could result in heightened market fluctuations.
Alternatively, higher prices would see more short positions flushed.


Source: Coinglass
ATOM needs to establish itself at $4.87 and $5 to determine whether it could have an uptrend.
A price rejection near $5 could produce a correction, yet a successful break through this level could signal further upward price movement.
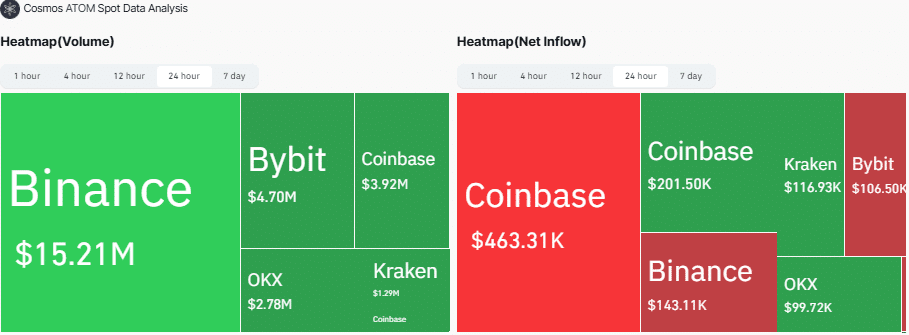
Volume and netflow of spot trades
Meanwhile, Binance maintained the highest ATOM spot volume position at $15.21M, Bybit at $4.70M while Coinbase obtained $3.92M. The exchange pairs of OKX and Kraken yielded $2.78M and $1.29M respectively.
Coinbase’s first account saw a $463.31K outflow while Coinbase, Kraken and OKX maintained positive inflows totaling $201.50K, $116.93K and $99.72K correspondingly.
Binance and Bybit saw withdrawals worth $143.11K and $106.50K into their platforms respectively.


Source: Coinglass
The withdrawals could indicate investors taking profits or redistributing funds, while the inflows suggested the exchanges still remained in a position of gaining additional funds.
The surge in some of the exchange’s asset intake showed signs that ATOM could continue increasing in value. If the platforms kept draining assets, it could trigger momentary downward pressure on ATOM and other tokens.

