
- UNI my be breaking out of an Adam & Eve pattern, signaling a potential 30% upswing
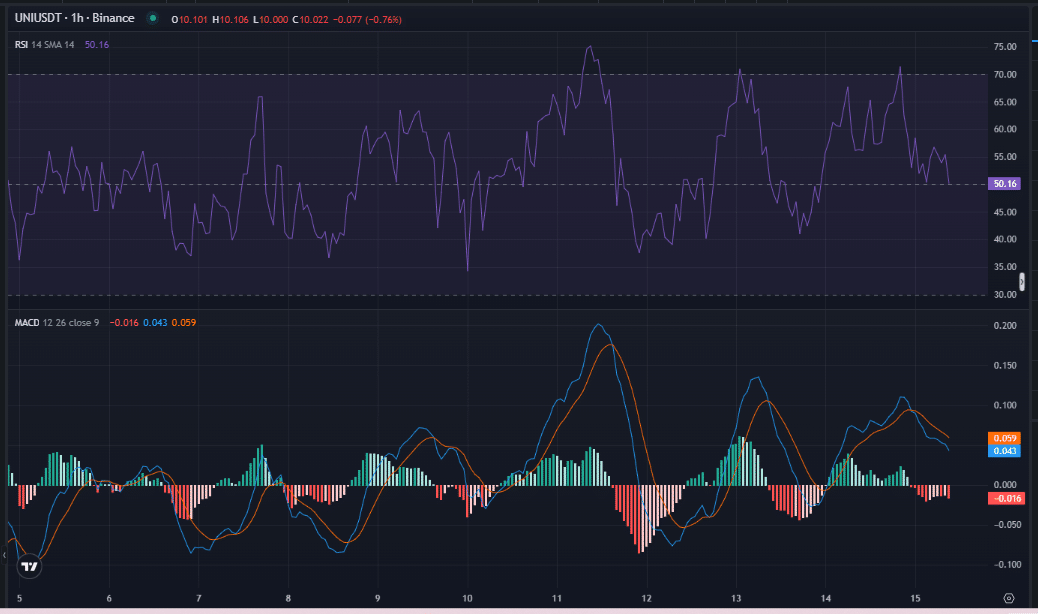
- Altcoin’s RSI had a reading of 50.16 at press time, without quite leaning towards overbought territory
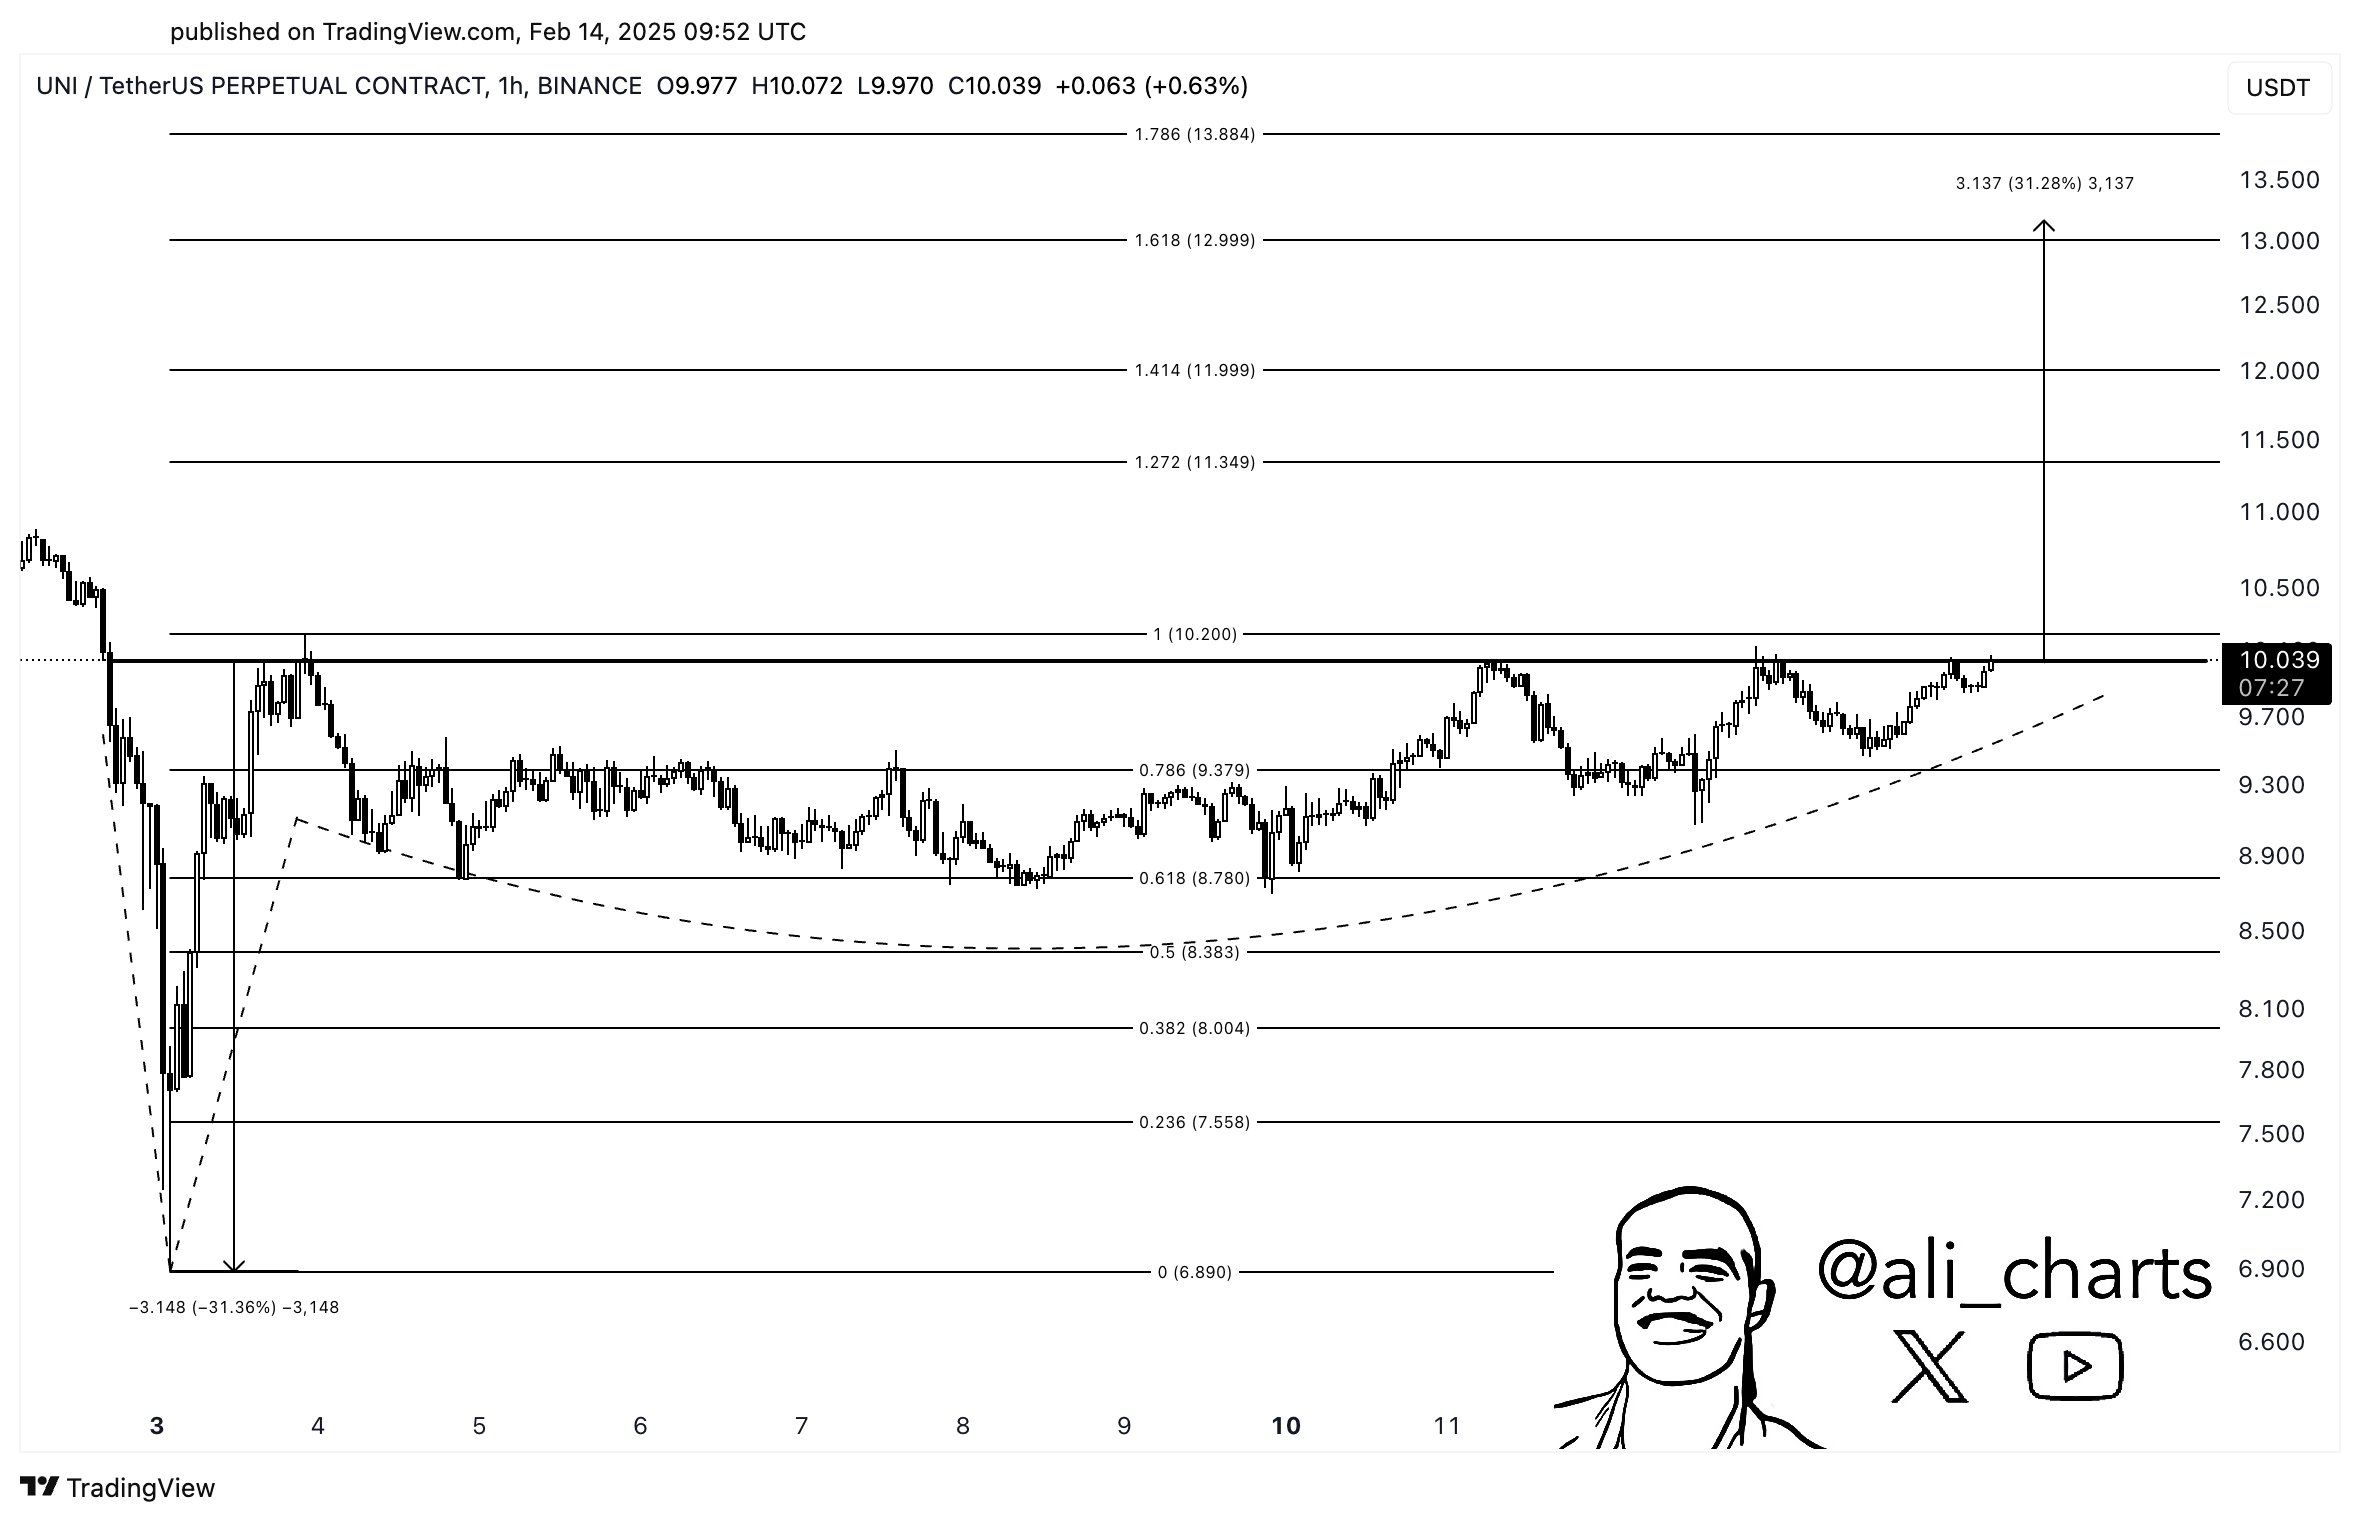
Uniswap [UNI] made news and grabbed the attention of many across the crypto market after its breakout from an Adam & Eve pattern. In fact, such was the scale of the breakout that many now expect a potential 30% upswing towards $13 on the charts.
A key signal for UNI’s upswing
The Adam & Eve pattern signifies a transition from a downtrend to an uptrend. This pattern is formed by a sharp ‘Adam’ peak, followed by a more rounded ‘Eve’ trough, which typically represents consolidation before a breakout.
A breakout from this pattern could hint at a shift in market sentiment, with the same followed by significant price movement.
Source: X
The MACD’s bullish crossover highlighted the uptick in buying momentum across the market. Additionally, the histogram flashed positive values, reinforcing the buying strength following the breakout.
Source: Coinglass
At the time of writing, the RSI stood at 50.16, signaling a neutral market. However, it seemed to be moving towards overbought territory – A sign that buying pressure could continue and make the $13 target more plausible.
This combination of the Adam & Eve pattern, bullish MACD crossover, and rising RSI suggested that UNI might see major growth soon. This would be in line with the projected 30% price hike.
Minimal selling pressure signals opportunity
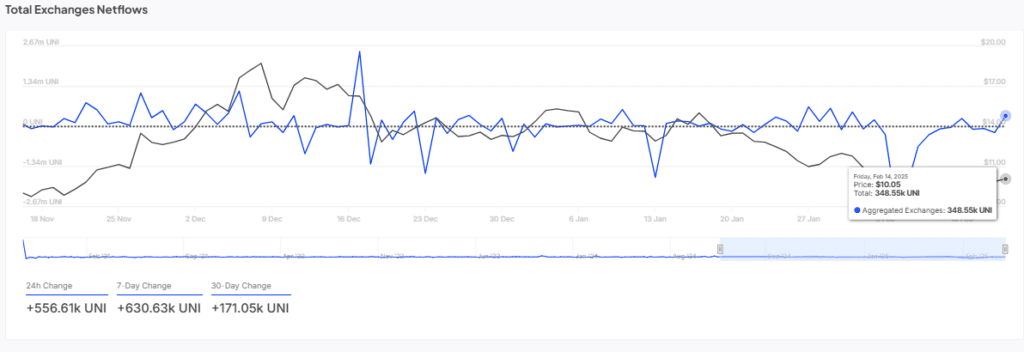
Total Netflow analysis shared some insights into how much UNI is flowing into or out of exchanges.
A significant netflow into exchanges could mean high selling pressure, while a fall in netflow would hint at accumulation by investors.
Source: IntoTheBlock
As can be seen here, UNI’s market saw modest netflows of 348.55k UNI on 14 February 2025. This alluded to minimal selling pressure, which bodes well for the bullish case. When selling pressure is low, upward price movements tend to face less resistance, supporting the likelihood of a sustained rally towards $13.
Key levels for UNI’s price action
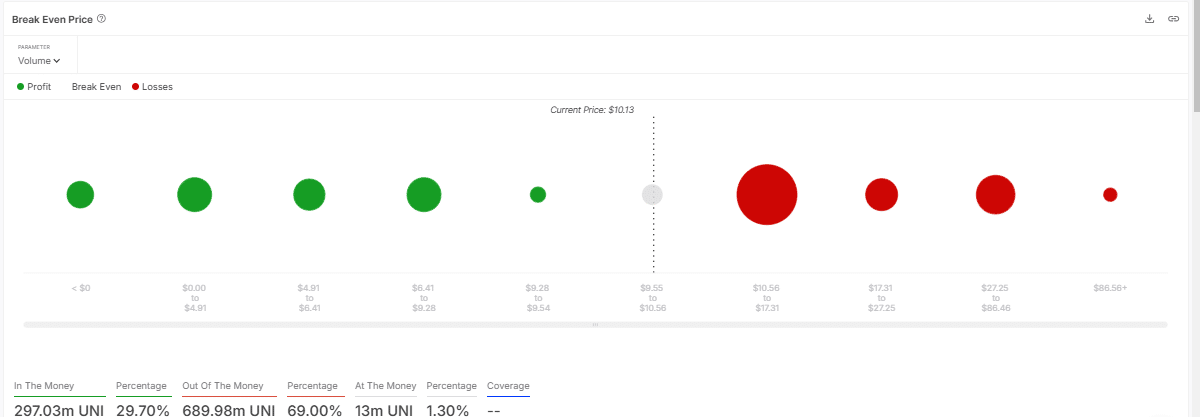
The Break-Even Price chart revealed that a significant portion of UNI holders are currently in profit, with $297.03 million in UNI profitable. This positions many investors to either hold or buy more, potentially pushing the price higher.
Source: IntoTheBlock
On the other hand, $689.98 million worth of UNI remains at a loss. If the price moves towards break-even levels, those in the red may start buying, contributing to greater upward pressure.
This dynamic implied that as UNI moves closer to the $13-target, more buying activity could accelerate the price surge.
How buying pressure can fuel UNI’s rise
Finally, the Cumulative Volume Delta (CVD) chart provided a deeper understanding of net buying and selling pressure.
A recent trend towards negative CVD hinted at a hike in selling pressure. However, a reversal of this trend could signal a shift towards buying, reinforcing the bullish sentiment.
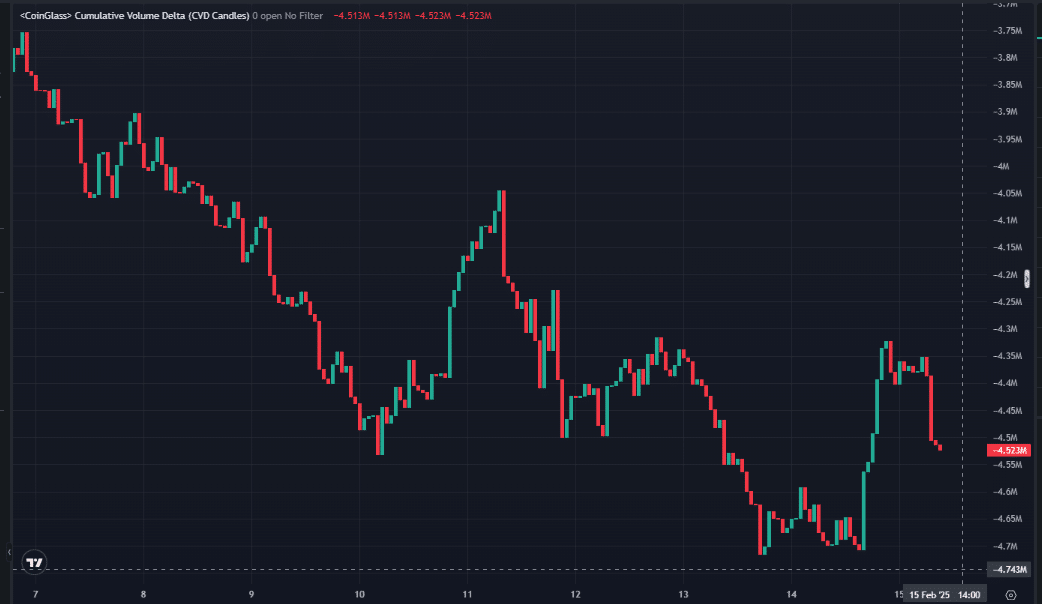
Source: CoinGlass
The breakout from the Adam & Eve pattern, coupled with a positive shift in CVD, could confirm the ongoing buying momentum. If selling pressure subsides and buying intensifies, UNI is likely to move closer to the $13 target, signaling strong market absorption of sell orders.