- The altcoin market cap increased against the Bitcoin market cap fall.
- The launch of the spot Ethereum ETFs could send Bitcoin dominance further down.
AMBCrypto’s analysis revealed that the Bitcoin [BTC] dominance chart has been decreasing. On the 10th of July, the dominance was 55.10%. However, at press time, it was down to 54.62%.
Bitcoin dominance is an important indicator of BTC’s price. This is because it shows how the coin’s market cap compares to the market cap of other cryptocurrencies.
Can BTC dominance continue?
If Bitcoin’s dominance increases, it means that the coin is outperforming the average altcoin. However, when it decreases, it indicates that BTC is losing momentum and altcoins are performing better.
On a Year-To-Date (YTD) basis, the coins have performed better. But over the last month, and in recent times, the opposite has been the case. If this continues, Bitcoin could fall further despite the correction it has had.

Source: TradingView
At press time, BTC changed hands at $58.257. This represented a 1.37% increase in the last seven days. However, an indicator to check if Bitcoin is beginning to lose it superiority is the TOTAL2.
The TOTAL2 is also known as the total market cap of the crypto market excluding BTC. If it increases, it means altcoins are showing a stronger performance than Bitcoin.
But when it decreases, it implies that BTC is leading the market resurgence.
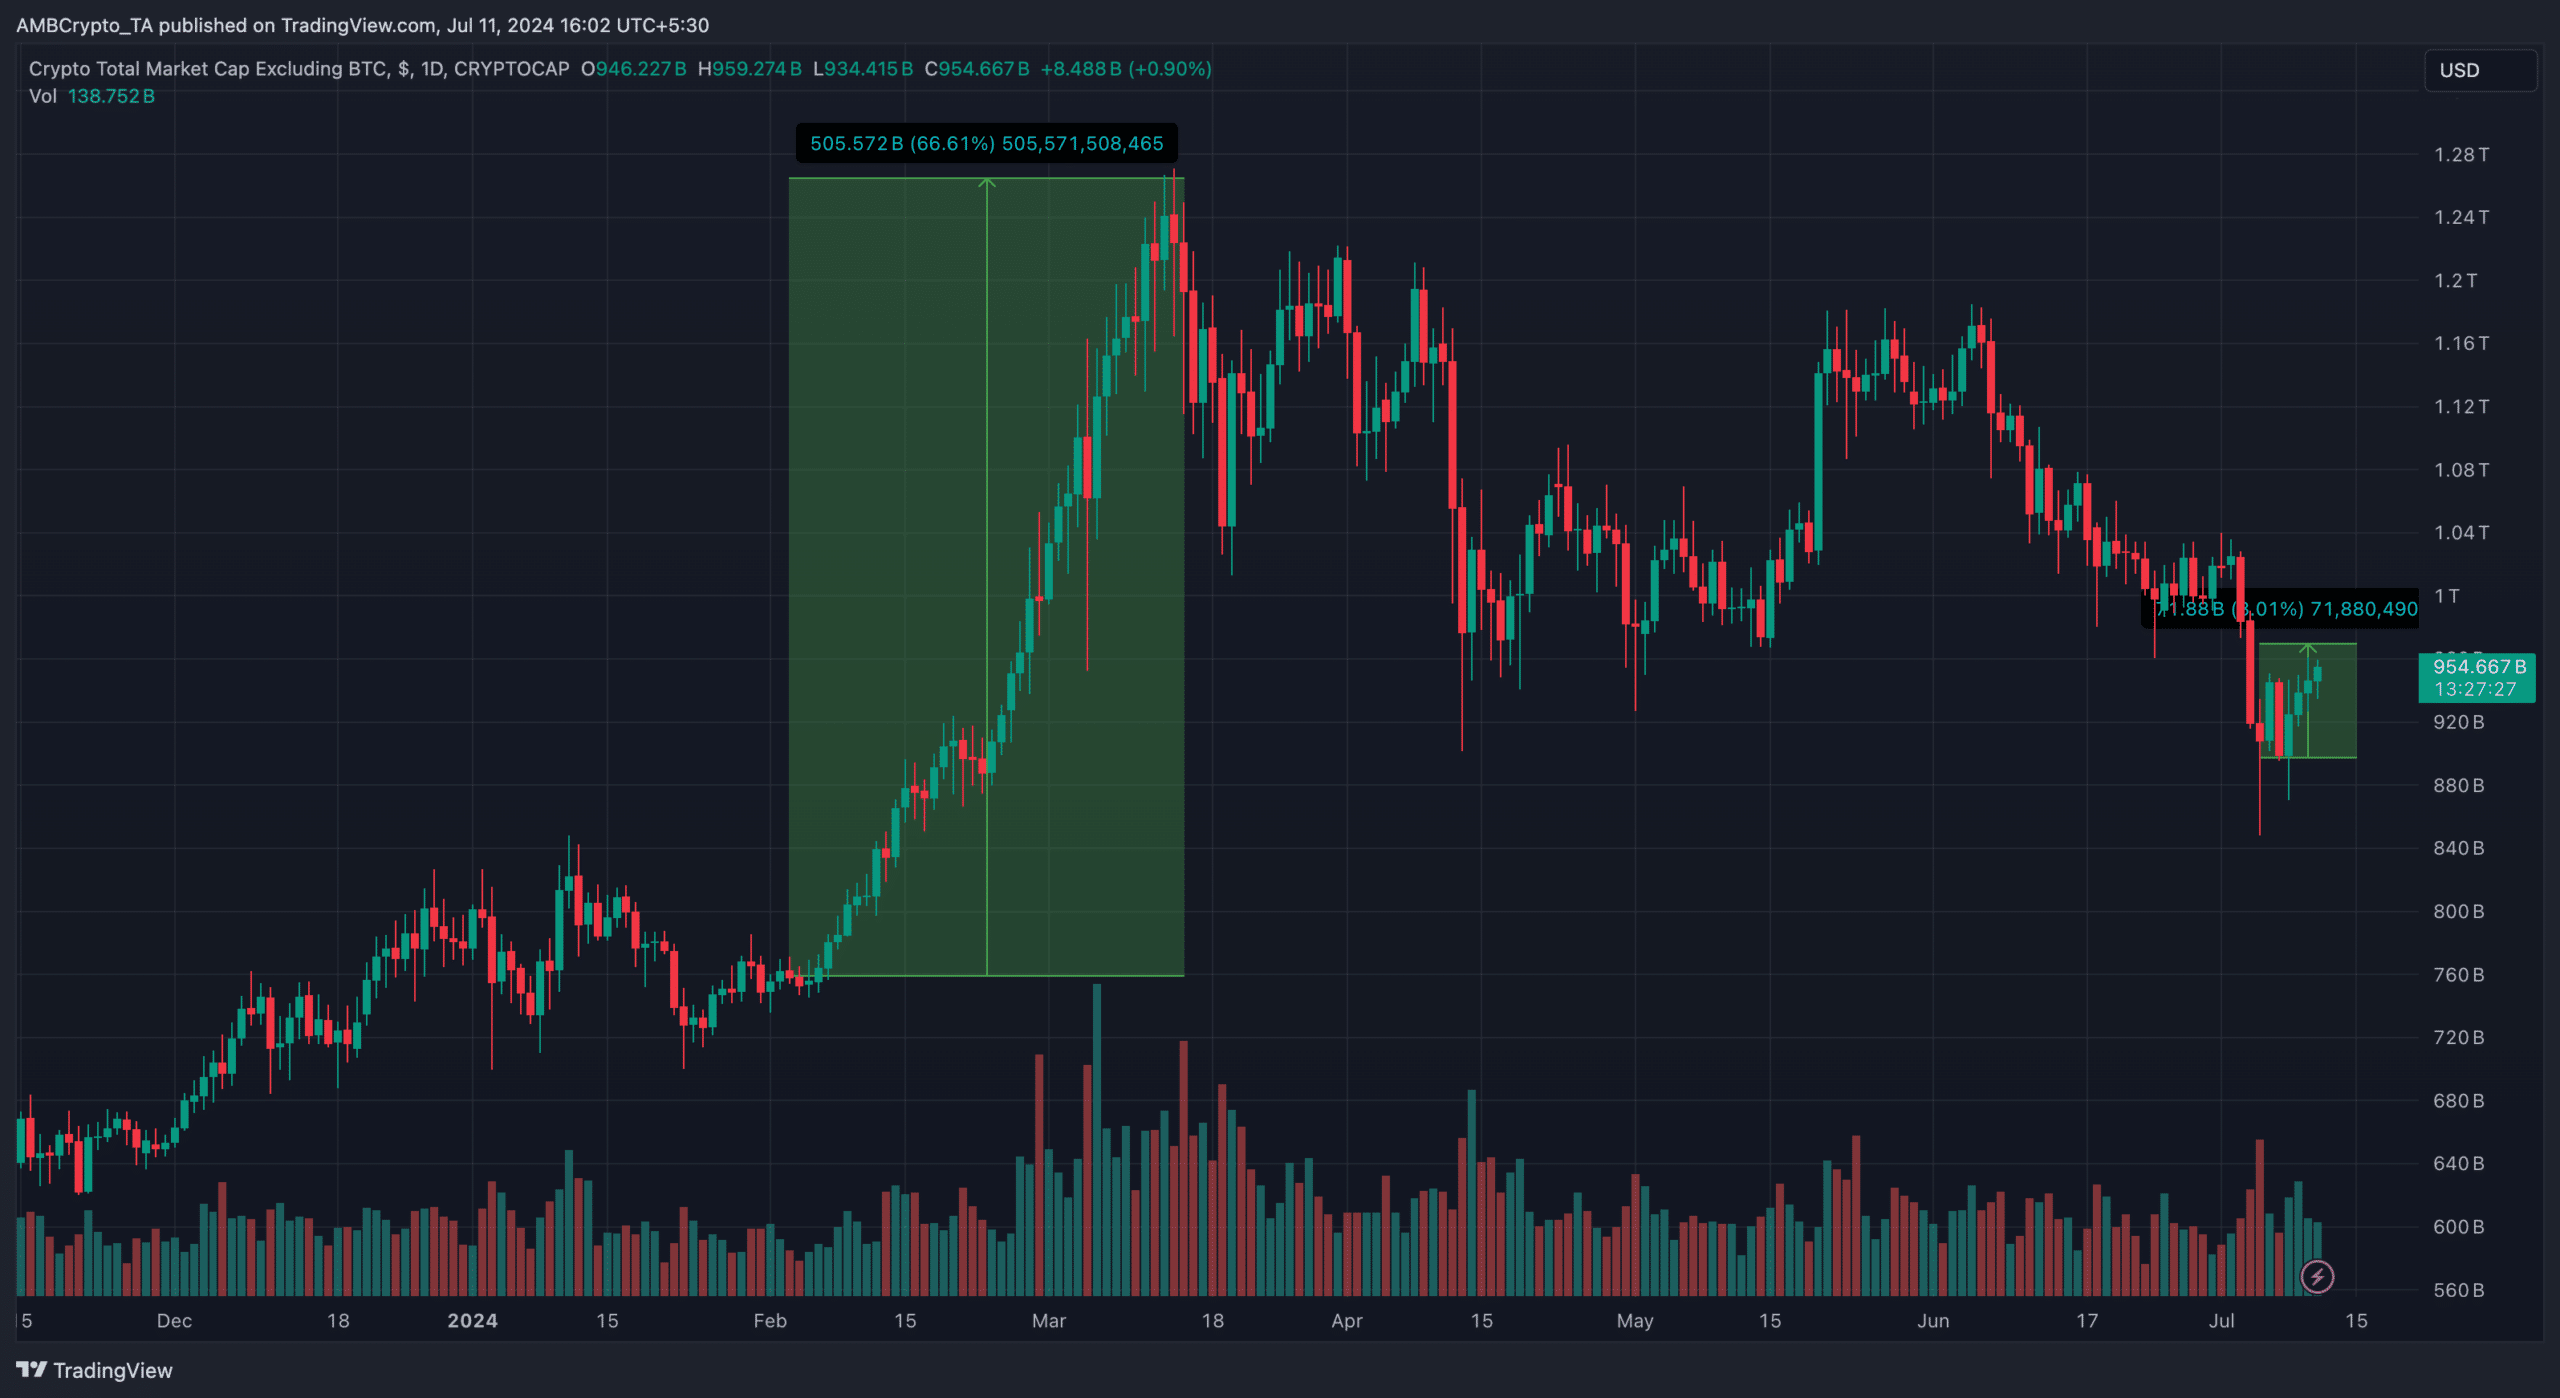
Between the 5th of July and the time of writing, the TOTAL2 has risen by 8.01%, indicating that the prices of the average altcoins have been better than Bitcoin dominance.
Altcoins are prepared to give the king a fight
The last time, the indicator took such steps, the market cap jumped by 66.61% between February and March as the market cap also crossed $1.20 trillion. At press time, the market cap was $953.68 billion.
If this continues to increase, it can hit $1 trillion, possibly driving a closer move to the much-anticipated altcoin season. If this happens, the BTC’s correction would continue.


Source: TradingView
One factor that can drive an increase in the dominance is Ethereum [ETH]. Historically, when ETH’s price performance better than BTC, it gives strength to other altcoins.
In turn, it reduces Bitcoin dominance. One catalyst market participants are looking forward to is the launch of the spot Ethereum ETFs.
However, it is also important to look at the ETH/BTC chart to see if the altcoin would take over Bitcoin dominance in the coming weeks.
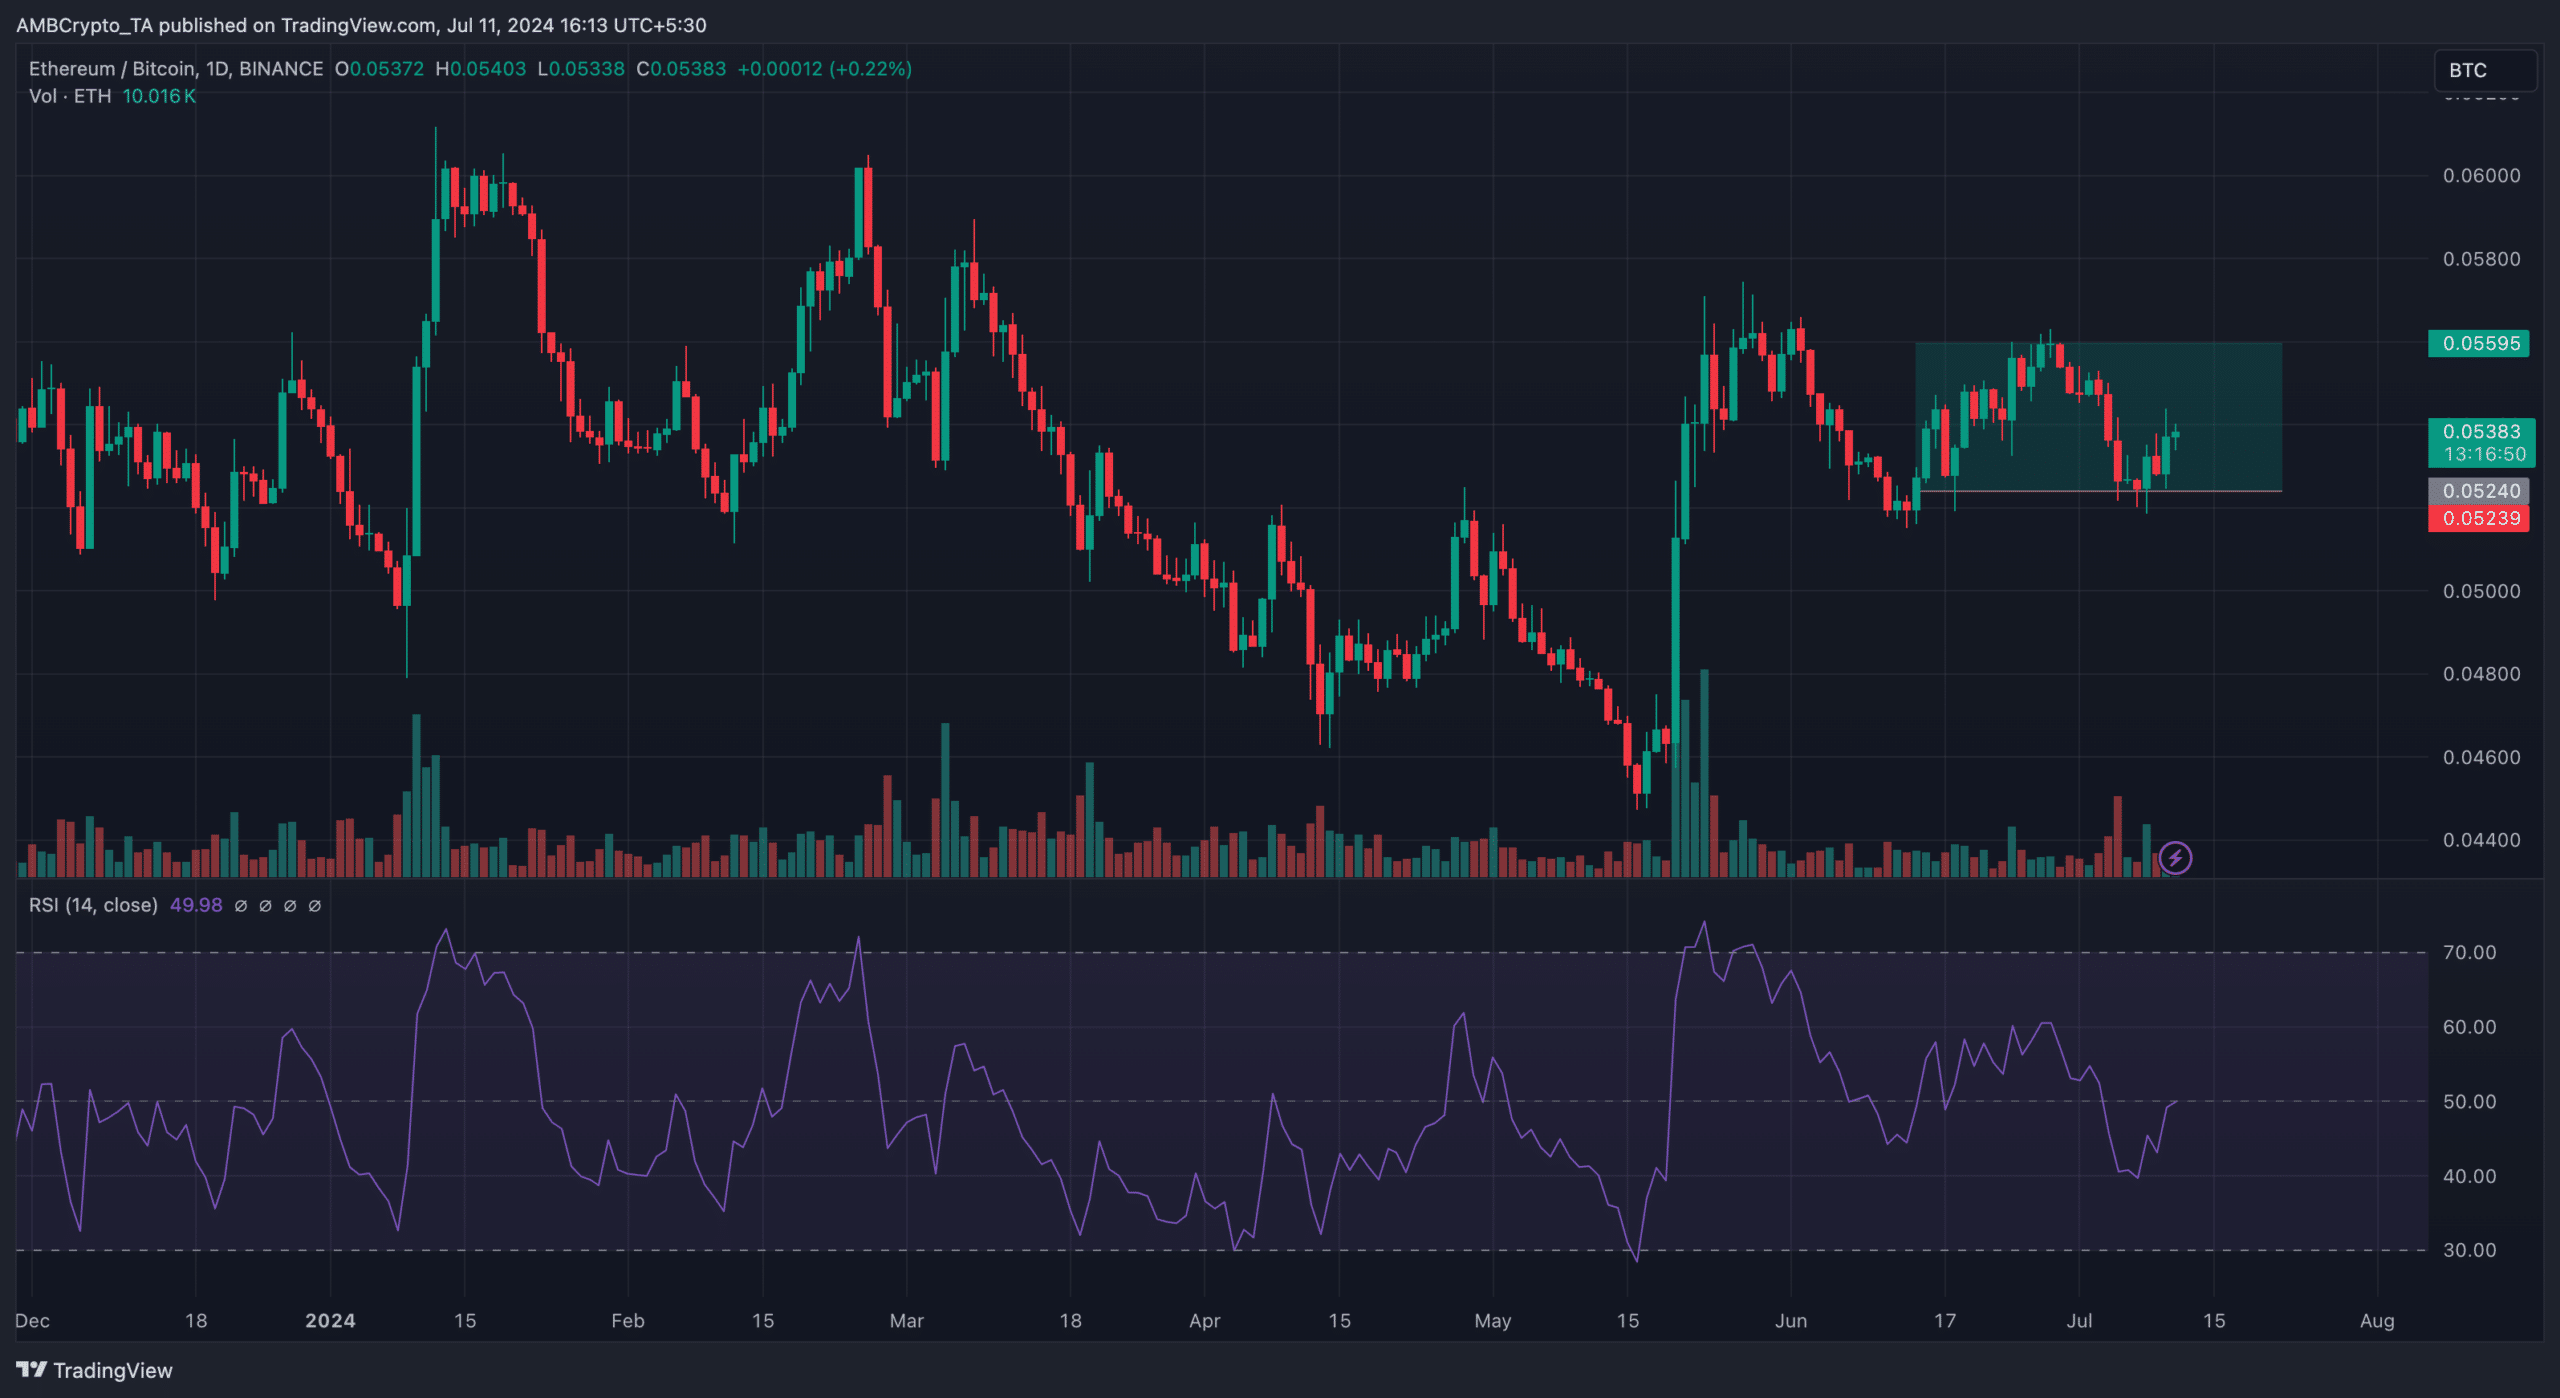
When the ETH/BTC increases, it means that Ethereum is outperforming Bitcoin. But a decrease suggests otherwise. Previously, the ETH/BTC ratio was 0.051.


Source: TradingView
Realistic or not, here’s BTC’s market cap in ETH terms
But as of this writing, that has increased to 0.053, meaning 1 ETH equaled 0.053 BTC. In addition, the Relative Strength Index (RSI) revealed that ETH was gathering a good level of momentum.
If sustained, this could drive the ratio to 0.056, and possible send Bitcoin dominance down.

