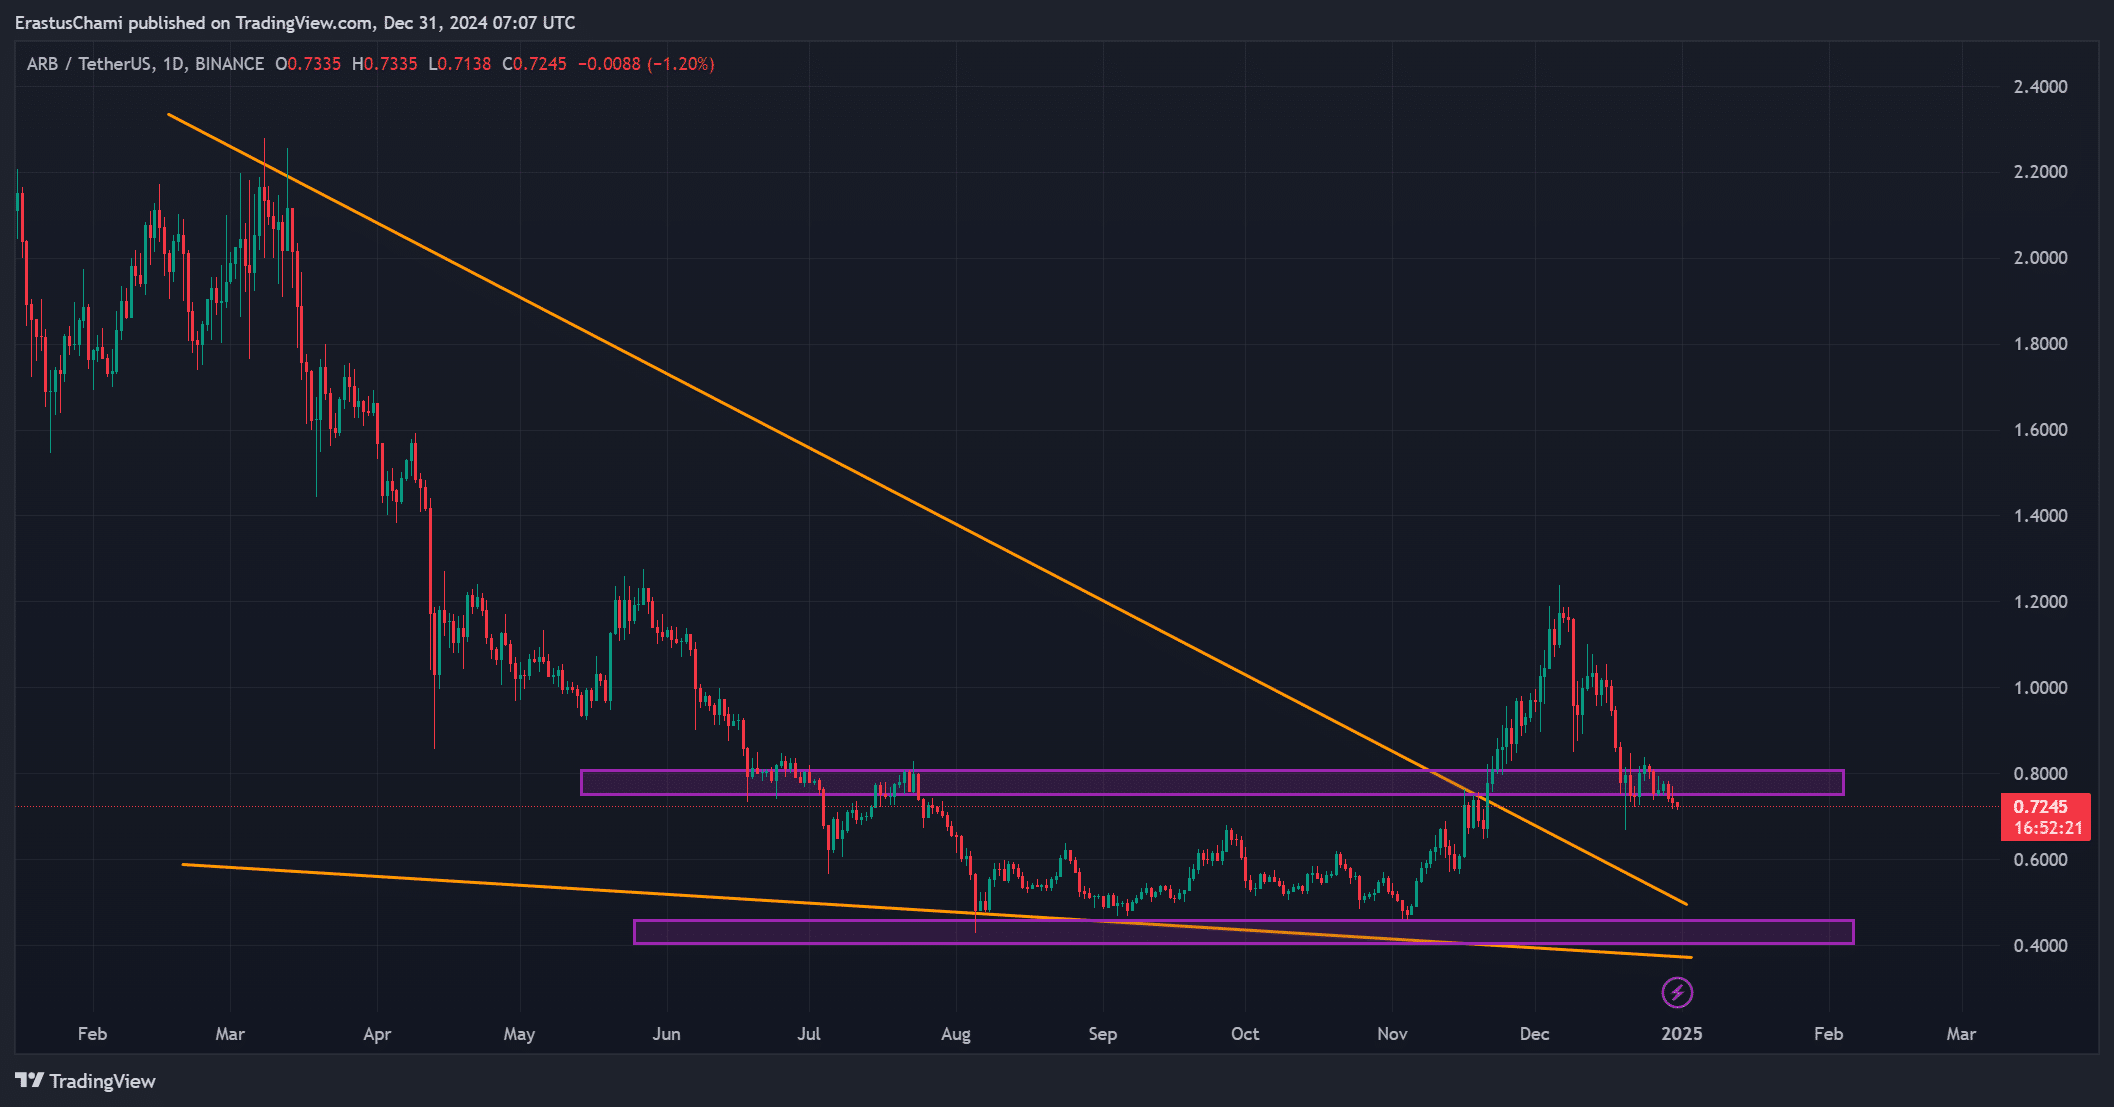
- ARB breaks below a key demand zone as technical indicators confirm continued bearish momentum.
- On-chain metrics and declining market sentiment highlight weak engagement and growing downside risks.
Arbitrum [ARB] continues to face significant bearish momentum, trading at $0.72166, reflecting a 5.54% decline over the past 24 hours.
The cryptocurrency’s break below a critical demand zone highlights increased selling pressure and growing uncertainty about its recovery potential.
Both technical indicators and on-chain metrics suggest that further declines may be on the horizon unless market conditions improve quickly.
With ARB struggling near key levels, the coming sessions could prove crucial.
Breakout below critical demand zone raises concerns
ARB has breached a critical demand zone, signaling intensified selling pressure that aligns with its ongoing downtrend since November.
The next potential support level appears around $0.65, with the long-term resistance trendline remaining intact.
This downward movement highlights the lack of significant buying activity, which could accelerate further declines.
Moreover, traders are closely watching for any shifts in momentum that could stabilize the price at current levels.

Source: TradingView
ARB technical indicators show bearish signals
Technical metrics provide little optimism for ARB in the short term. The Relative Strength Index (RSI) stands at 37.13, nearing oversold territory and indicating heightened selling pressure.
Additionally, the Moving Average (MA) cross highlights a bearish trend, with the 9-day MA at $0.7682 and the 21-day MA at $0.8505.
These figures suggest that ARB’s downward trajectory may persist unless a surge in buying volume occurs soon. Therefore, technical indicators confirm that bearish momentum remains strong.


Source: TradingView
On-chain metrics point to declining confidence
ARB’s on-chain metrics reinforce the bearish outlook, reflecting reduced activity and interest. Net Network Growth has fallen by 0.98%, signaling slower adoption within the ecosystem.
The “In the Money” metric declined by 0.22%, while Concentration dropped by 0.13%, indicating reduced investor engagement.
Large Transactions saw a notable decrease of 14.73%, further reflecting lower institutional activity.
Additionally, the Price DAA Divergence stands at 14.89%, showcasing a significant gap between user engagement and price performance, as per Santiment analytics.
These metrics suggest waning confidence in ARB’s near-term potential.


Source: IntoTheBlock
ARB market sentiment reflects trader hesitation
Market sentiment echoes the challenges, with open interest declining by 2.90% to $163.69 million.
This drop highlights reduced trader participation and limited new positions being opened, signaling hesitation to enter ARB at current levels.
Furthermore, the lack of notable buying interest suggests continued pressure on the cryptocurrency, leaving it vulnerable to further declines unless sentiment improves drastically.


Source: Coinglass
Read Arbitrum’s [ARB] Price Prediction 2024–2025
Conclusion: Downside more likely?
Based on the technical and on-chain data, ARB is more likely to experience additional downside in the near term.
Weak market sentiment, declining user engagement, and bearish technical signals make recovery unlikely without significant positive developments. At present, the bearish trend appears poised to continue.

