
- Development activity for APT has waned as its price surged, sounding alarms across the market.
- Analysis indicates that APT is currently at a crossroads, pending a definitive trend emergence.
After days of notable decline, Aptos [APT] has shown signs of recovery, increasing by 5.48% and offering a brief respite to the market.
However, the question remains: Is this upturn durable, or merely a brief relief for weary sellers before the price potentially falls again? AMBCrypto explores this even further.
The bears are knocking
Low development activity suggests that bears are dominating the market. A divergence between the price of an asset and its development activity indicates a market imbalance that often necessitates correction.
In simpler terms, this means the price (green line) may soon adjust to align with the current level of development activity (blue line), or conversely, development might accelerate to match the price movement.
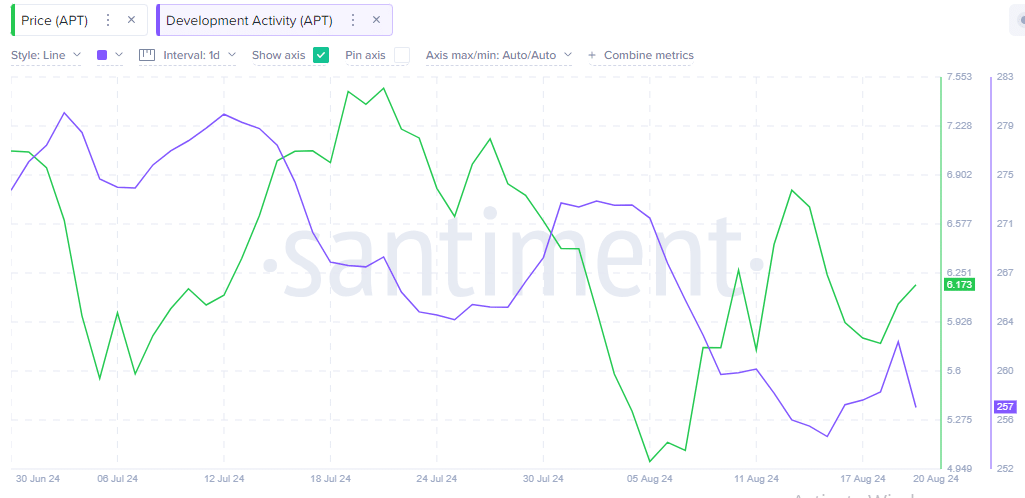
Source: Santiment
However, in this scenario, a price retracement is more likely. A similar divergence on July 16th saw the price initially rise as development activity dropped, only for the price to eventually decrease, realigning with the lower development activity.
The downward move intensifies
APT is navigating a month-long descending channel, presenting mixed signals on the technical front. Within such a channel, the price of an asset can either breach the upper boundary, suggesting an upward breakout or break through the lower bound, indicating a potential fall.
Currently, the upper boundary is acting as resistance; APT has rebounded from this level but has only gained partial upward momentum, which AMBCrypto’s analysis suggests may not be sustainable.
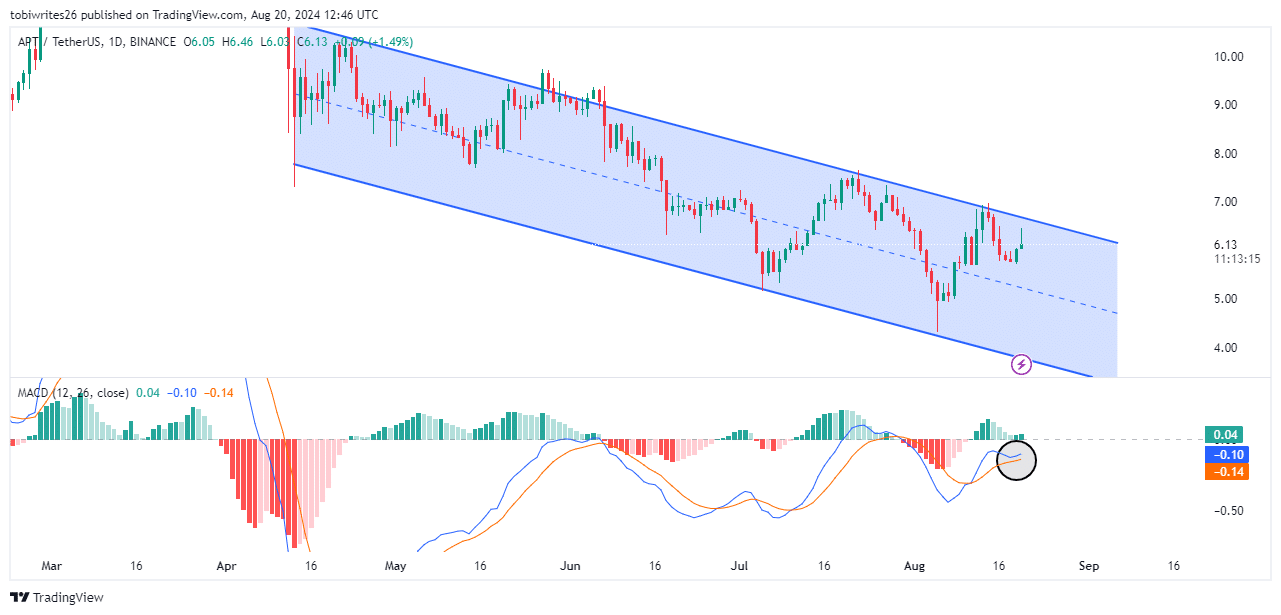
Source: TradingView
This analysis used the Moving Average Convergence Divergence (MACD), a momentum indicator that illustrates the relationship between two moving averages of a security’s price.
It signals buying opportunities when the MACD line (blue) crosses above the signal line (orange) and indicates sell signals when it crosses below.
Currently, the MACD line resides in a negative zone with decreasing volume and is about to cross below the signal line. Given APT’s current price of $6.15, it is likely to experience further declines.
Slight hope: APT remains bullish among retail investors
Open interest, which represents the total number of unsettled derivative contracts like options or futures, has been on a significant rise since August 6 according to Coinglass, signaling a high market participation.
As open interest increases, it indicates that new contracts are being opened and existing ones are closing or being fulfilled, which says APT has a bullish outlook.
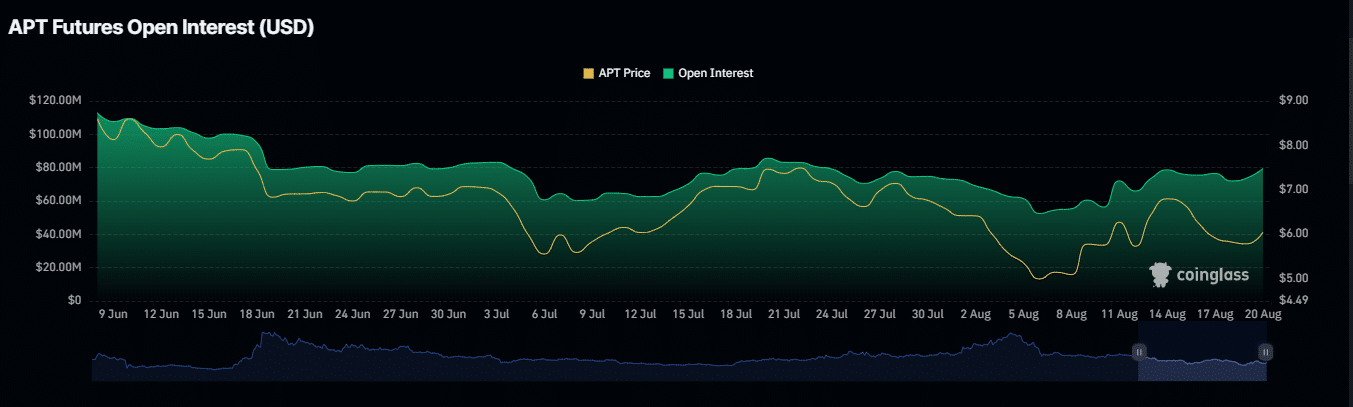
Source: Coinglass
Additionally, the Netflow of APT across exchanges has been negative in both the 24-hour and 7-day timeframes, a sign typically interpreted as bullish.
Read Aptos’ [APT] Price Prediction 2024-25
This suggests that market participants are choosing to store their APT in wallets or other offline storage, reflecting confidence in the asset’s potential for growth.
In conclusion, despite mixed signals, it’s important to allow the market time to reveal clearer buying or selling indications.