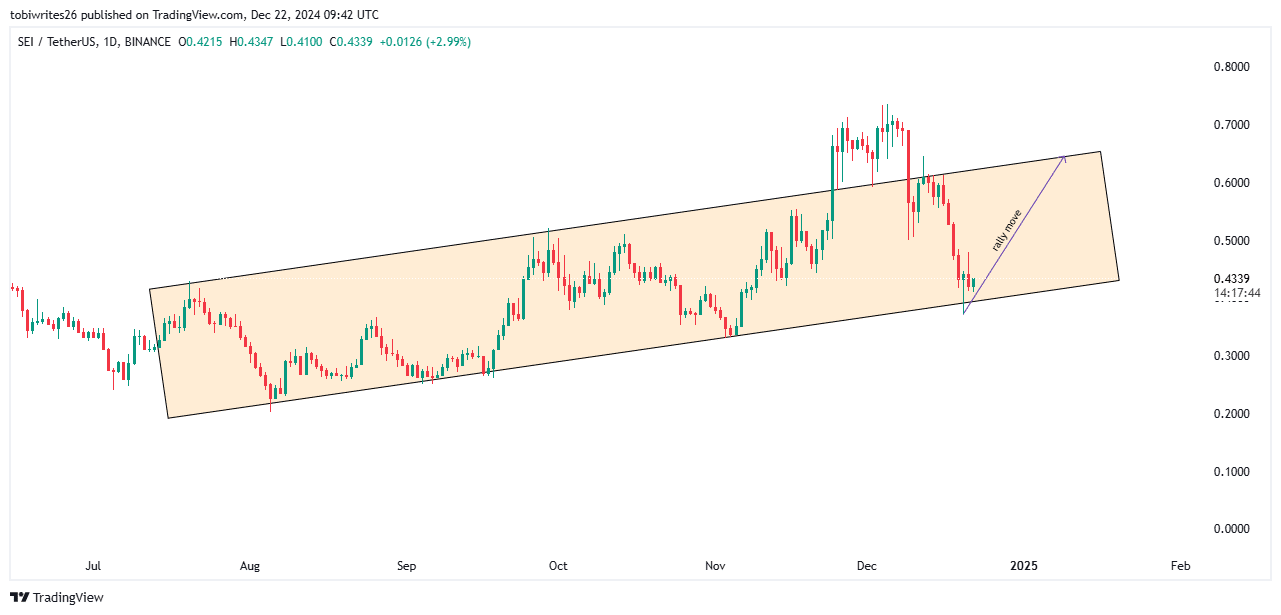
- The price has tested the bottom of its ascending channel, a potential indicator of an upward move.
- However liquidity movement within SEI’s blockchain and to exchanges, tells a decline could be near.
Sei [SEI] has seen a steady decline from a major resistance zone, leading to a 9.48% drop over the past month. In the last 24 hours, the asset has fallen further, losing 5.95%.
Market trends remain inconclusive, leaving traders to weigh key technical levels and metrics for clearer direction which AMBCrypto has identified.
An upward path emerges
On the chart, SEI has retreated to the lower boundary of its ascending channel, otherwise known as support, after experiencing a sharp rejection at the channel’s resistance level.
From this support level, the asset’s likely move, based on technical patterns, would be an upward trend, potentially targeting $0.65.

Source: TradingView
However, its next significant move for the new target—whether a rally or a pullback—will depend on the level of selling pressure at that resistance point.
Top traders position for an upswing
According to Coinglass, top traders on Binance are showing a bullish bias toward SEI. This conclusion is drawn from the long-to-short ratios based on account sizes and position sizes among these traders.
The long-to-short (accounts) ratio for top traders on Binance currently stands at 3.65, indicating that more accounts are betting on SEI’s price moving higher.
Similarly, the long-to-short (positions) ratio, which measures the amount of capital allocated to long positions versus shorts, is at 2.2286. This suggests that bullish traders have invested significantly more capital in long positions compared to shorts.
Further evidence of this bullish sentiment comes from liquidation data. Over the past four hours, short liquidations totaled $14,230, compared to $1,340 in long liquidations.
This imbalance reflects increased pressure on short traders as SEI’s price shows upward momentum.
Liquidity flow opposes SEI
The current liquidity flow in the market is against SEI, with minimal activity indicating that funds are not being directed toward the asset.
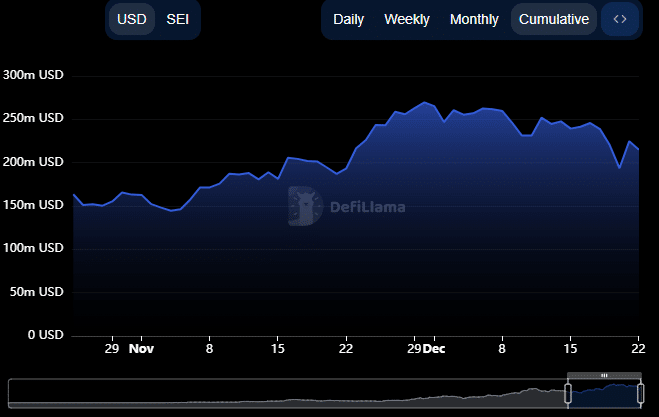
The Total Value Locked (TVL), a metric that represents the total capital deposited into SEI-related protocols for activities like staking, lending, and liquidity provision, has dropped to $216.44 million in the past 24 hours.
This drop follows a surge the previous day and continues the downward trend that began on November 30 according to DeFiLlama.


Source: DeFiLlama
Simultaneously, on Coinglass, the amount of SEI available on crypto exchanges has surged. Notably, the volume of SEI moved to exchanges has turned positive for the first time since October 14.
Realistic or not, here’s SEI’s market cap in BTC’s terms
A positive Exchange Netflow, as observed with SEI, indicates that spot traders are transferring their funds to exchanges in preparation to sell.


Source: Coinglass
If this trend persists, the price of SEI could decline further from its current trading level, with the support line remaining tenuous.

