- Spot Ethereum ETFs have experienced five consecutive days of positive netflows.
- The short-term decline is partly driven by derivative traders taking short position.
Over the past week, Ethereum [ETH] has surged by 22.5%, reaching $3,444.25 — a level not seen since July 24 of this year. However, it has since dropped by 6.37%.
According to AMBCrypto’s analysis, this suggested that the ongoing decline is temporary and unlikely to impact Ethereum’s longer-term outlook.
Five-day buying streak adds to ETH bullish outlook
Ethereum’s bullish outlook was gaining momentum, supported by a five-day buying streak from traditional investors, who are increasingly committing to ETH.
These investors have been consistently purchasing spot ETH ETFs from several major platforms.
As of this writing, Coinglass reported a positive Netflow in spot ETH ETFs, with a total of 213,570 ETH acquired during this period.

Source: Coinglass
This sustained acquisition, despite recent price fluctuations, signaled that traditional investors were maintaining strong long-term confidence in Ethereum, preparing for the next phase of upward movement.
Alongside this move by institutional investors, AMBCrypto has observed a similar trend among some spot traders.
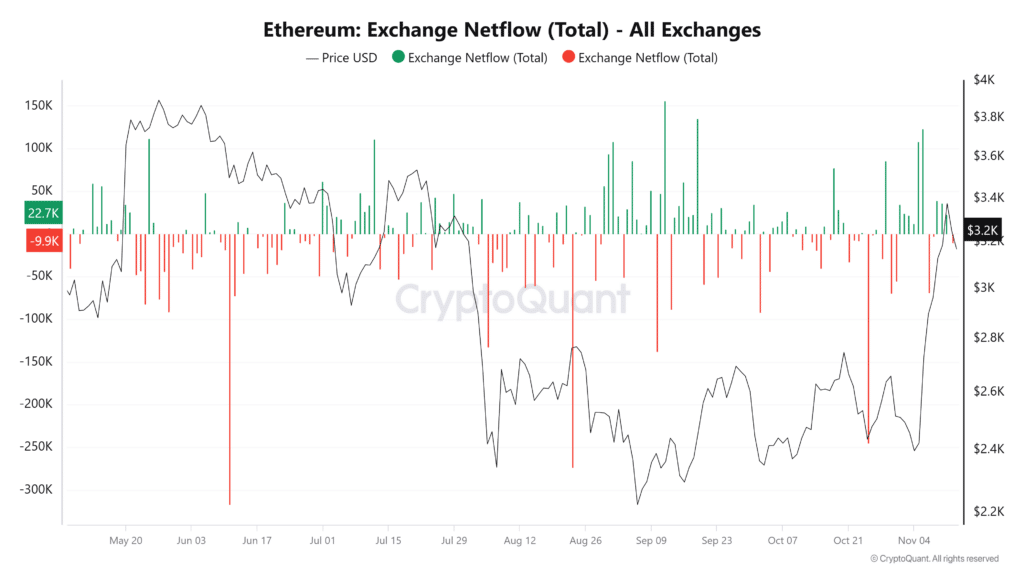
While traditional investors remained active, there has been a shift among some traders, with Exchange Netflow showing a negative turn — a 9,957.59 ETH outflow in the past 24 hours, according to Cryptoquant.


Source: Cryptoquant
Derivative traders turn bearish on ETH
Derivative traders have turned bearish on ETH, with significant long liquidations recorded in the past 24 hours.
A long liquidation occurs when the price moves against the position of long traders, who had bet on an upward trend but can no longer maintain their positions.
According to Coinglass, $98.73 million worth of long trades have been forcefully closed as the market trends downward.
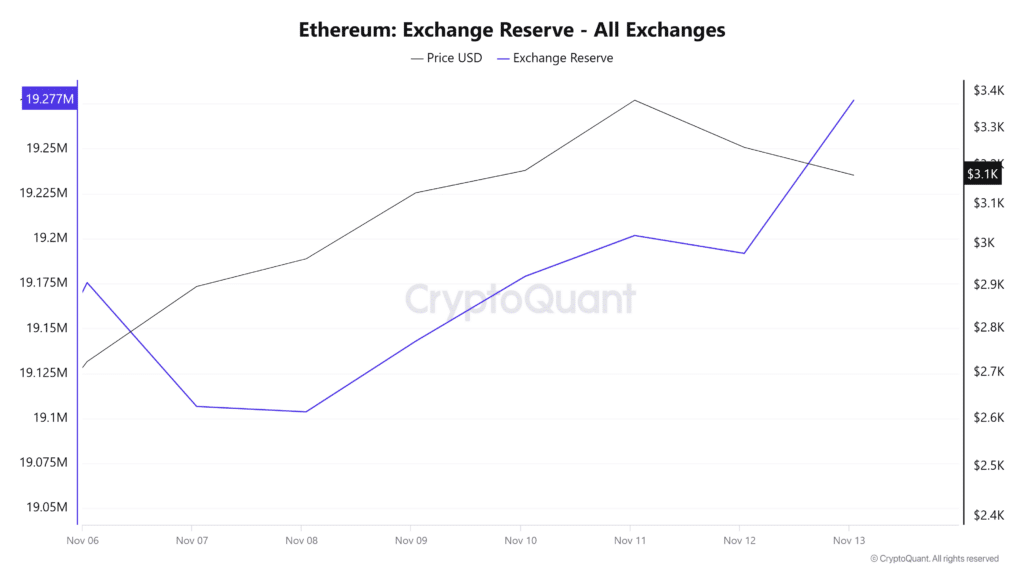
In parallel, Ethereum’s growing Exchange Reserve suggested an influx of ETH into exchange wallets, indicating that some traders are preparing to sell.


Source: CryptoQuant
Given these factors, ETH’s price is likely to experience further declines. However, the key question remains: how low will it go?
AMBCrypto has conducted further analysis to project potential price levels for ETH’s downturn.
A minor dip before resuming bullish rally
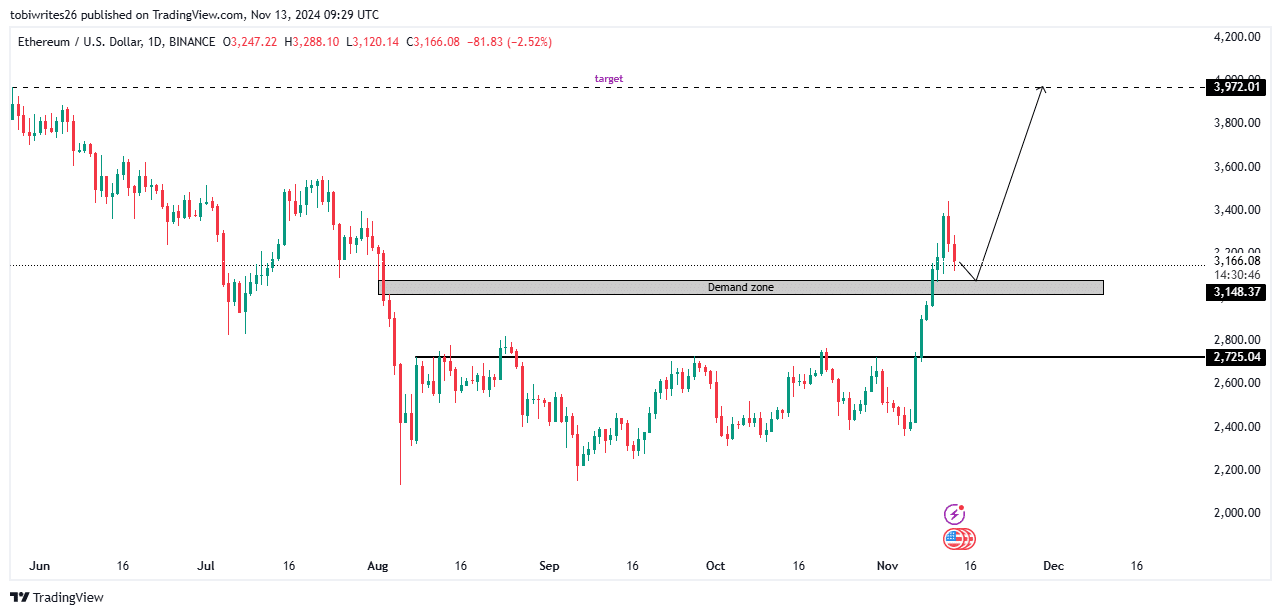
ETH continued to maintain a strong overall bullish structure, though a slight decline is expected before its rally resumes.
According to the daily ETH chart, the key demand zone where it will fall lies between $3,079.89 and $3,015.91.
This zone is expected to provide the buying pressure necessary to get ETH back on track for its bullish movement.
Read Ethereum’s [ETH] Price Prediction 2024–2025
Once ETH reaches this level, it is anticipated to make a significant upward move toward $3,972.01.


Source: TradingView
However, if bearish sentiment persists, ETH could see a further drop, potentially falling to $2,725.04 — a level that could serve as a catalyst for a renewed bullish surge.

