- XRP’s price increased by over 3% last week.
- The Long/Short Ratio suggested a price drop towards $0.48.
XRP’s price action has remained in investors’ favor for the last week, as both its daily and weekly charts were green. An analysis predicted that the token might be on the verge of showcasing a massive bull run.
However, the reality might be different.
How is XRP doing?
CoinMarketCap’s data revealed that XRP bulls were dominant last week, as the token’s price surged by more than 3%.
Things in the last 24 hours also remained optimistic, as XRP witnessed a 2% price rise over the last day.
However, this latest price boost couldn’t impact the token’s social metrics positively. For example, the token’s Social Volume dropped, reflecting a decline in the token’s popularity.
Its Weighted Sentiment also declined, meaning that bearish sentiment around the token increased.
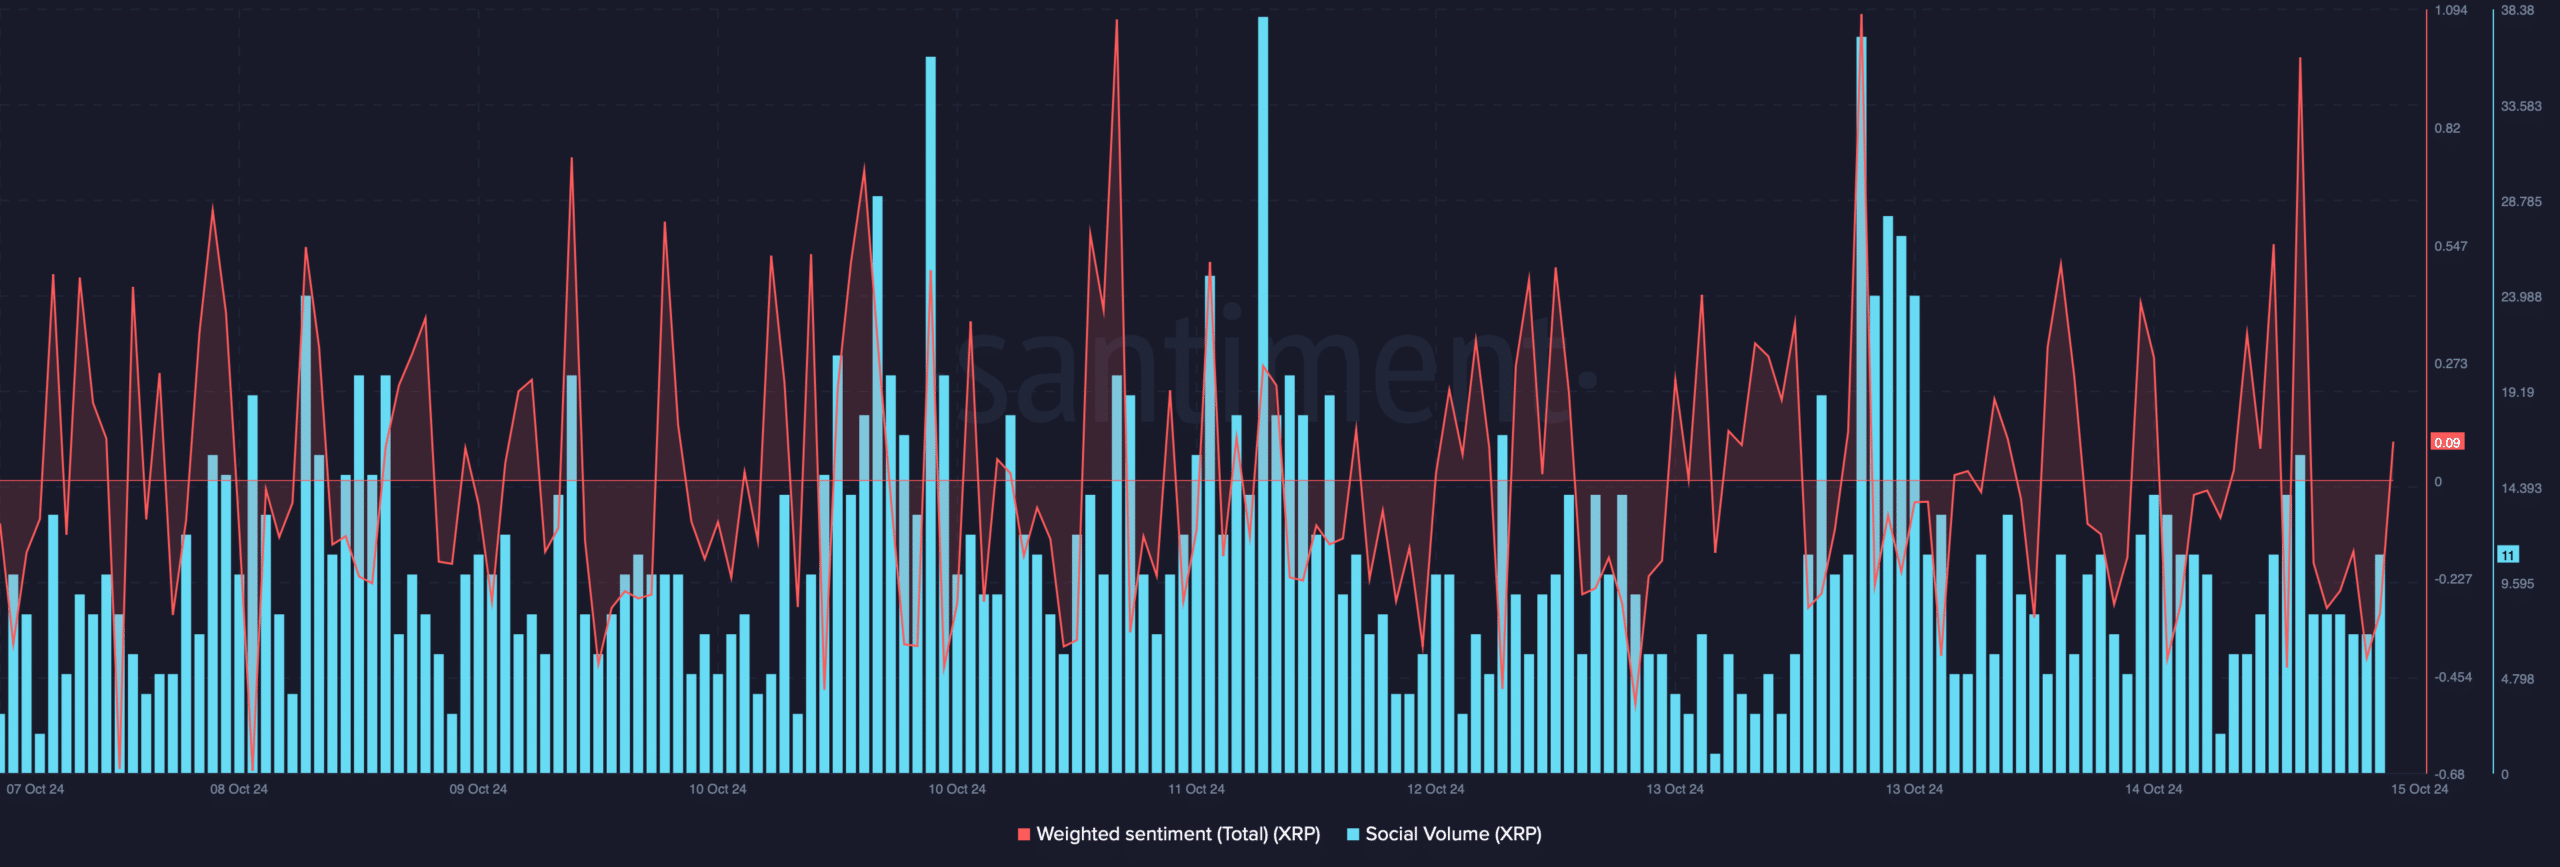
Source: Santiment
XRP’s near future
A few days ago, Amonyx, a popular crypto analyst, posted a tweet suggesting that XRP was awaiting a massive bull rally. The analysis seemed to have been considering the Elliott Wave Theory.

Source: X
For the uninitiated, the Elliott Wave Theory in technical analysis describes price movements in the financial market.
The theory involves mapping the tops and bottoms of a price chart and helps identify when an asset’s price could rise.
Coming back to Amonyx’s tweet, it highlighted a bullish pattern, and XRP was testing a resistance. A breakout could have initiated a bull rally.
A similar episode happened in the past, which allowed XRP to kickstart a bull run. However, that didn’t happen on this occasion, as the token witnessed a correction.
Therefore, AMBCrypto planned to take a closer look at XRP’s on-chain data to find out where the token was headed.
As per our analysis of Santiment’s data, network growth dropped sharply last week. This indicated that fewer new addresses were created to transfer the token.
Coinglass’ data revealed that XRP’s Long/Short Ratio also dropped. Whenever the metric declines, it means that there are more short positions in the market than long positions, which can be considered a bearish sign.
Nonetheless, the MVRV ratio looked hopeful as it improved in the last few days.
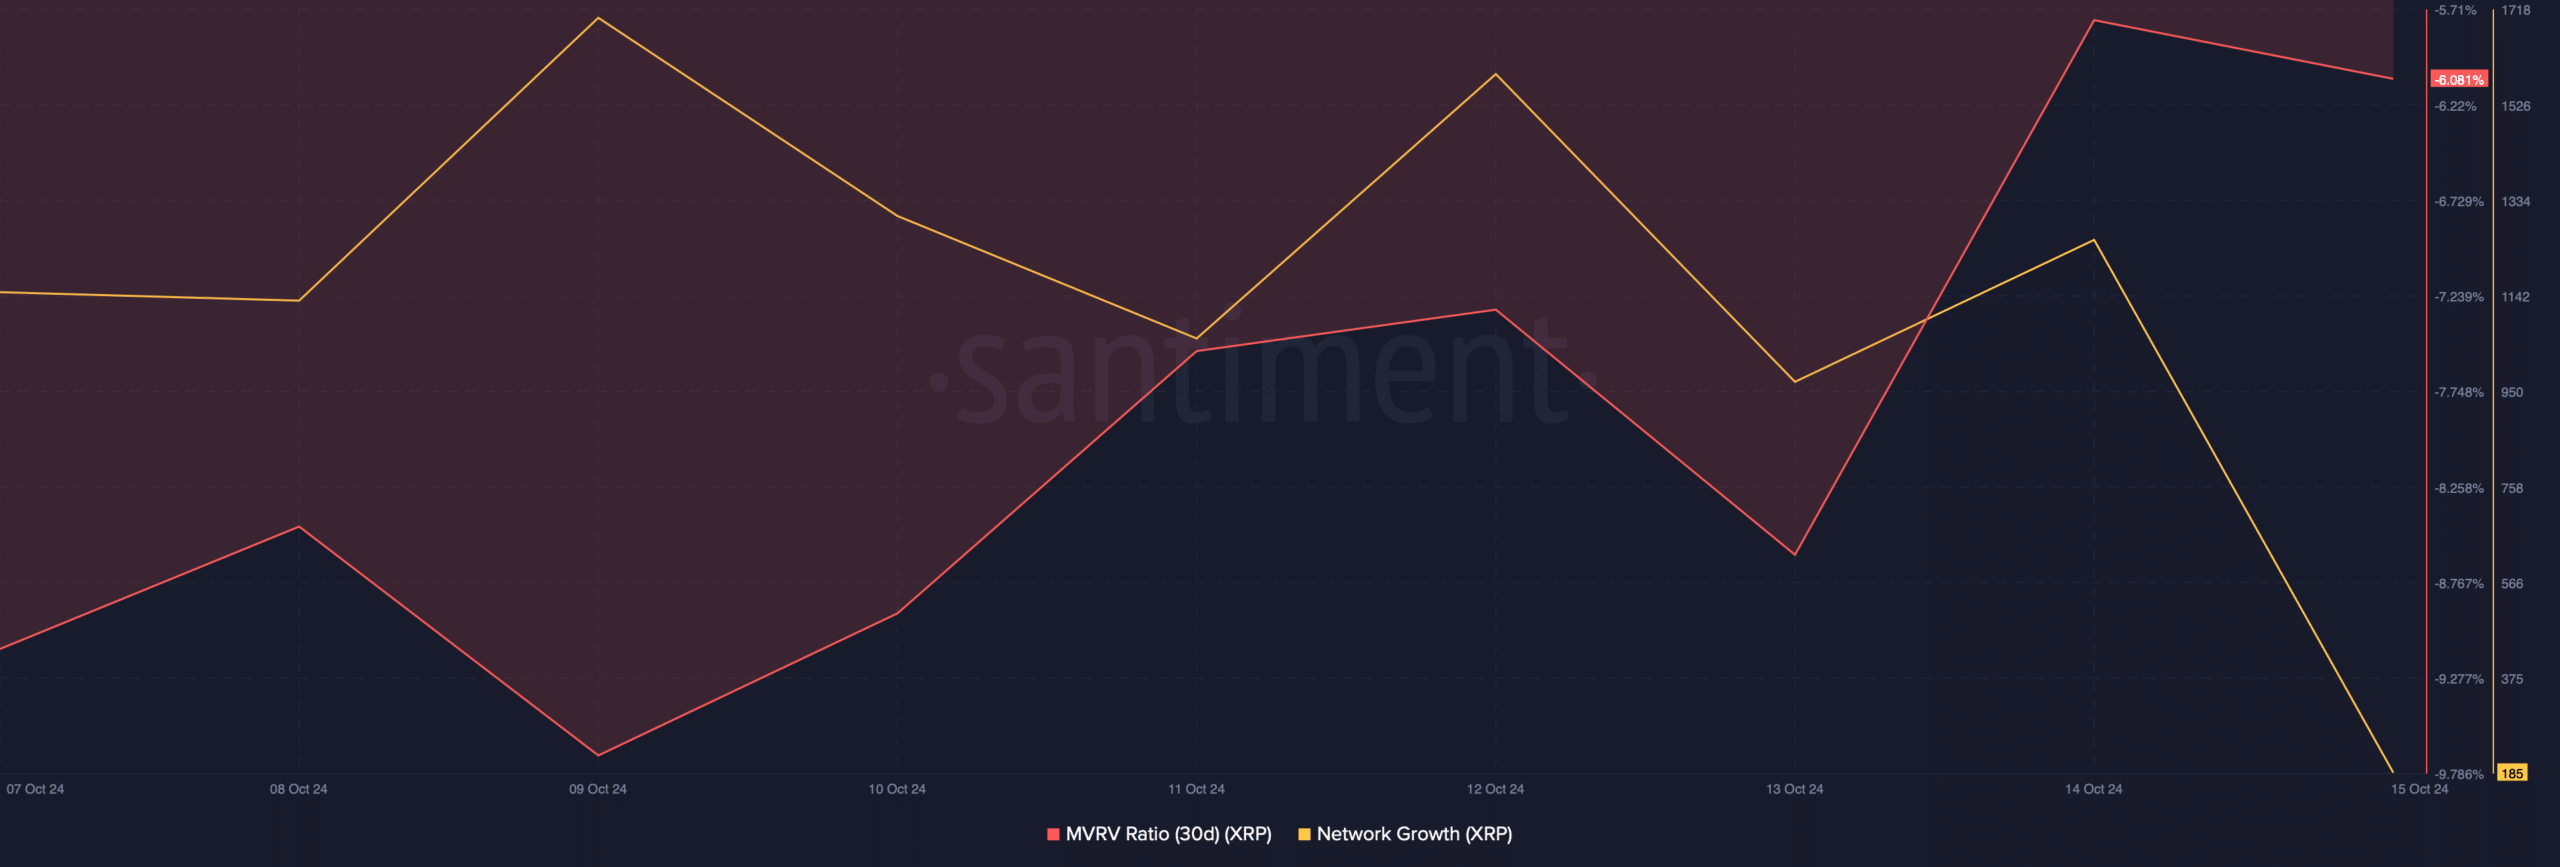
Source: Santiment
Realistic or not, here’s XRP’s market cap in BTC’s terms
We then took a look at the token’s daily chart to better understand the possible targets that the token can reach in the coming days. As per our analysis, the Relative Strength Index (RSI) registered a downtick.
If that results in a price drop, then XRP might soon drop to $0.48. However, the Money Flow Index (MFI) moved northwards, indicating a possible price hike towards $0.59.
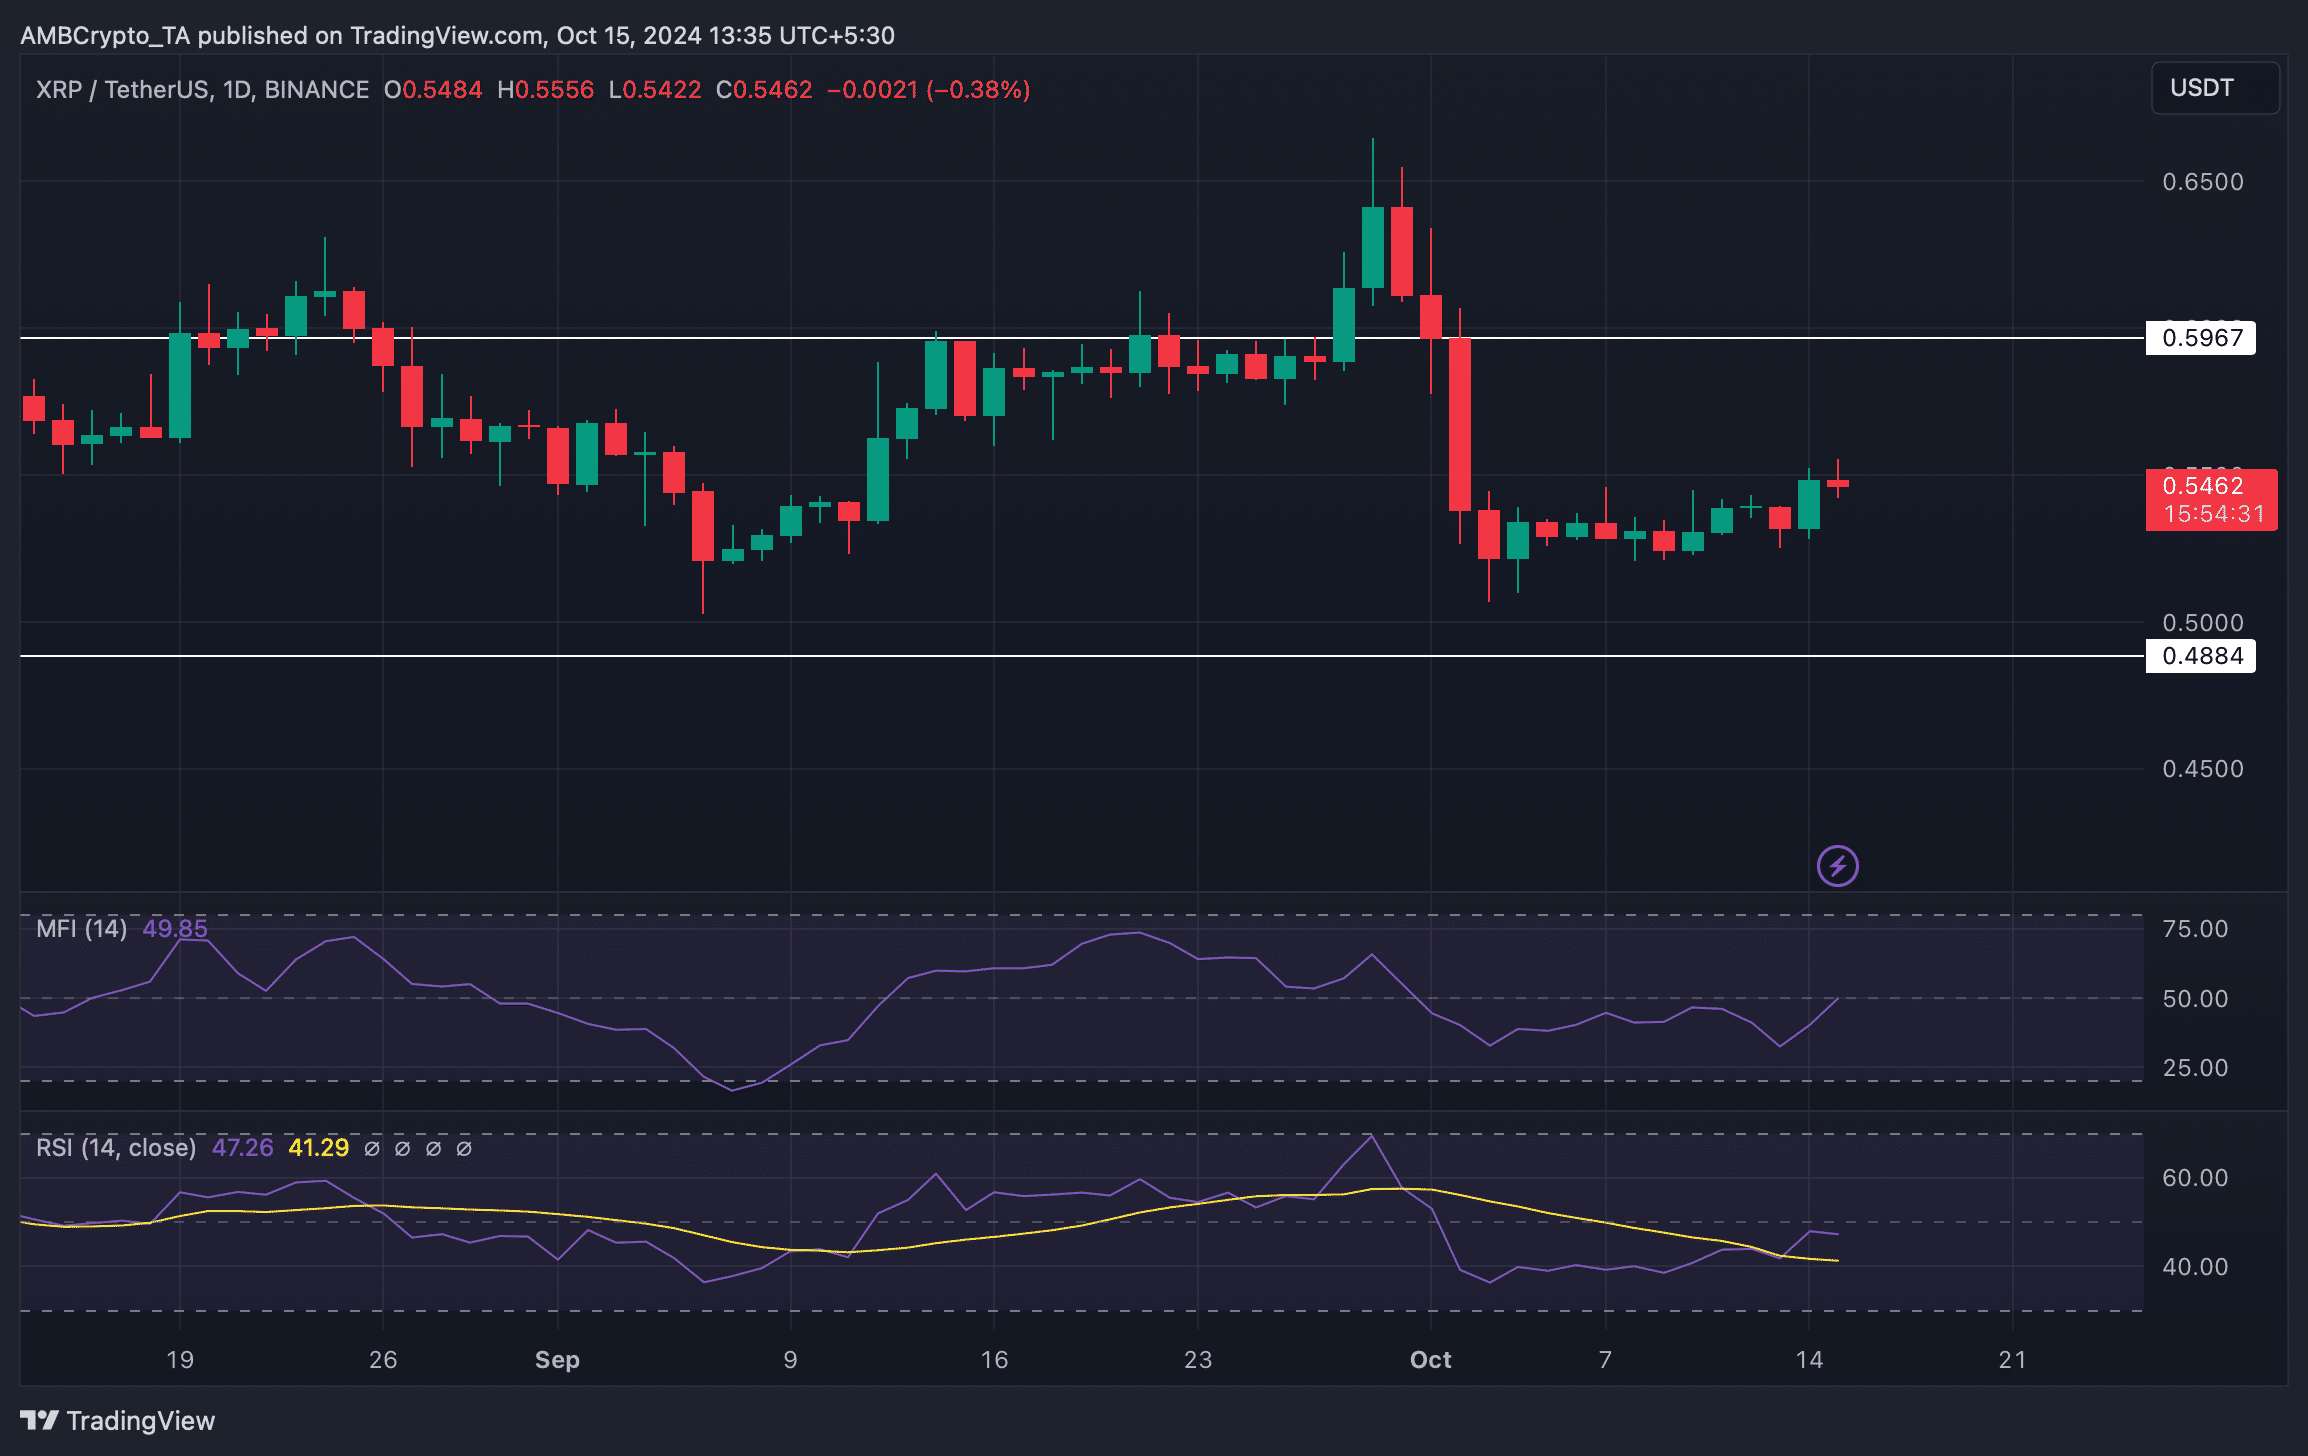
Source: TradingView