- At press time, market sentiment around the memecoin was fairly bearish
- In case of a correction, the memecoin might drop to $0.0000066 on the charts
PEPE’s price charts gained significantly over last 24 hours. Given the prevailing market conditions, the memecoin’s price action had many in the community talking.
However, this trend might not last for long, especially since a bearish update a few hours ago. Does this mean PEPE will once again record a price correction?
Selling pressure on PEPE rising?
CoinMarketCap’s data revealed that the frog-themed memecoin hiked by over 5% in the last 24 hours. At the time of writing, PEPE was trading at $0.00001001 with a market capitalization of over $4 billion.
Thanks to that, 219k PEPE addresses were in profit, which accounted for over 72% of the total number of the memecoin’s addresses.

Source: IntoTheBlock
However, AMBCrypto reported previously that PEPE’s uptrend might stall. As per our latest analysis, things might actually turn bearish in the coming days.
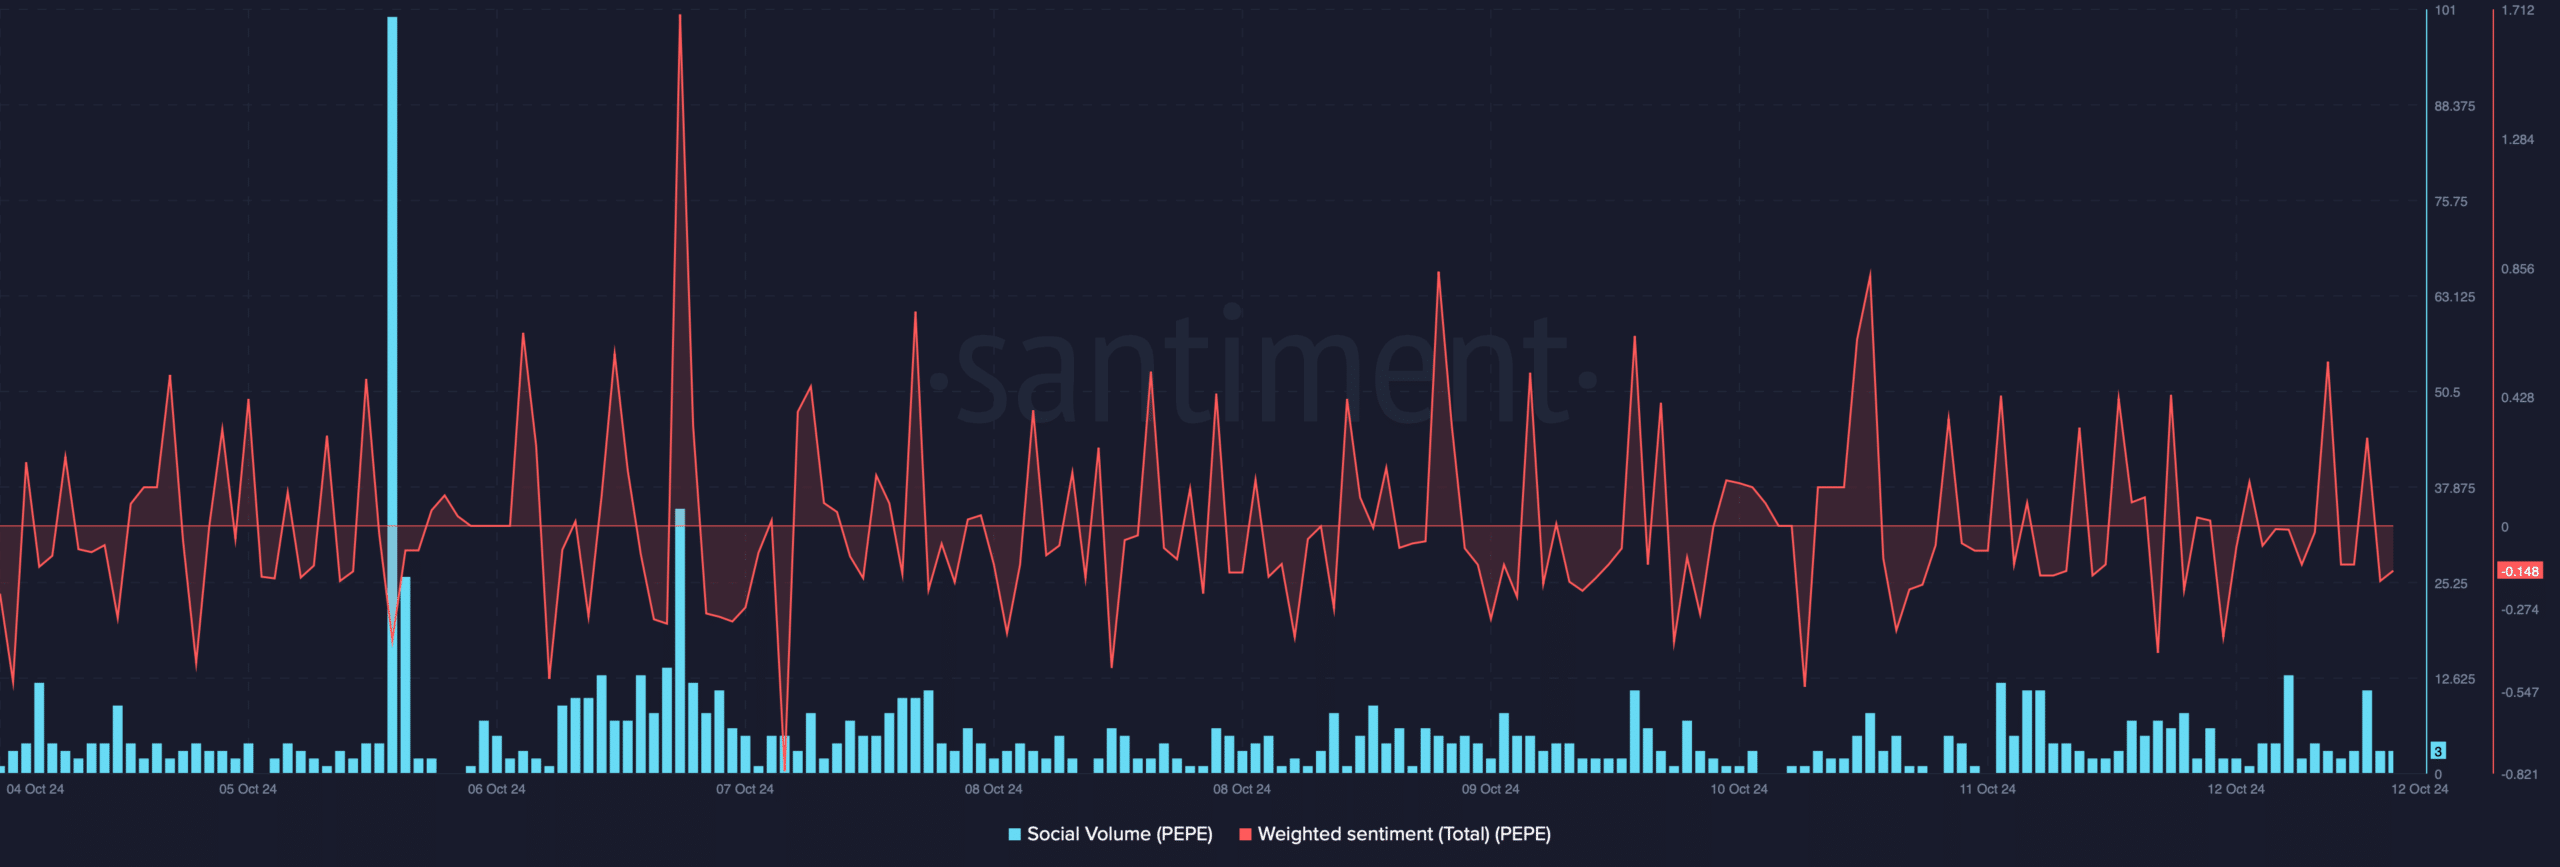
An assessment of Santiment’s data revealed that the memecoin’s weighted sentiment dropped to the negative zone. This suggested that bearish sentiment around the token increased. Moreover, its social volume also fell, reflecting a drop in the memecoin’s popularity.


Source: Santiment
In light of these findings, Lookonchain recently shared a tweet revealing an interesting development.
As per the tweet, a PEPE holder dumped its holdings and bought another crypto. The investor bought 81.55 billion PEPE ($800k) from 18 April to 15 May and generated $120k in unrealized gains. Later, the same investor exchanged 59.56 billion PEPE, worth $574k, for 754,943 SPX – Worth $684k.
This may be a sign of selling pressure rising. Hence, AMBCrypto checked the memecoin’s on-chain data to find out whether that is actually the case.
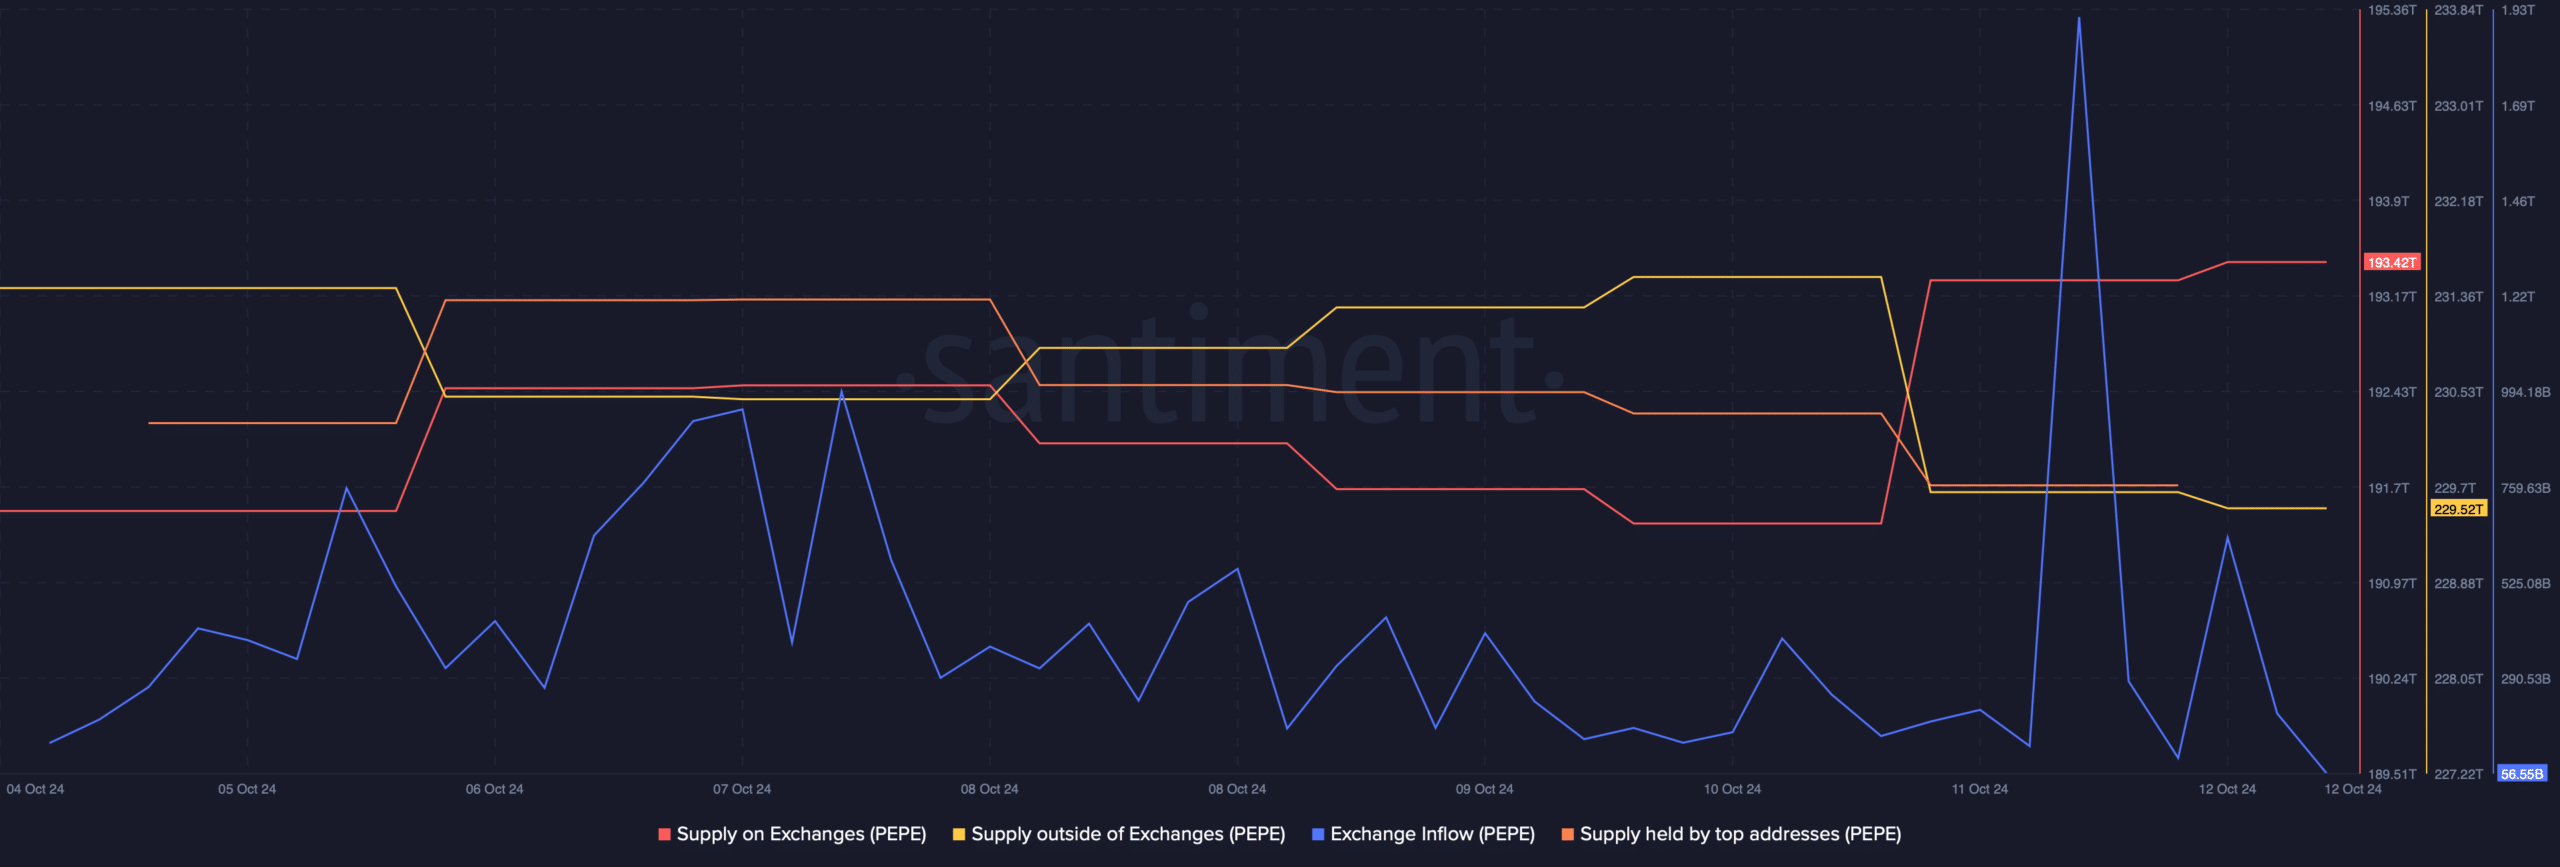
As per our analysis, PEPE’s supply on exchanges rose while its supply outside of exchanges dropped – A sign of a rise in selling pressure.
The fact that investors were selling was also proven by the spike in the memecoin’s exchange inflows. Additionally, there was also a drop in the supply held by top addresses.


Source: Santiment
Mapping PEPE’s way ahead
Since the aforementioned metrics hinted at a price correction, AMBCrypto finally assessed the memecoin’s daily chart to find its possible support zones.
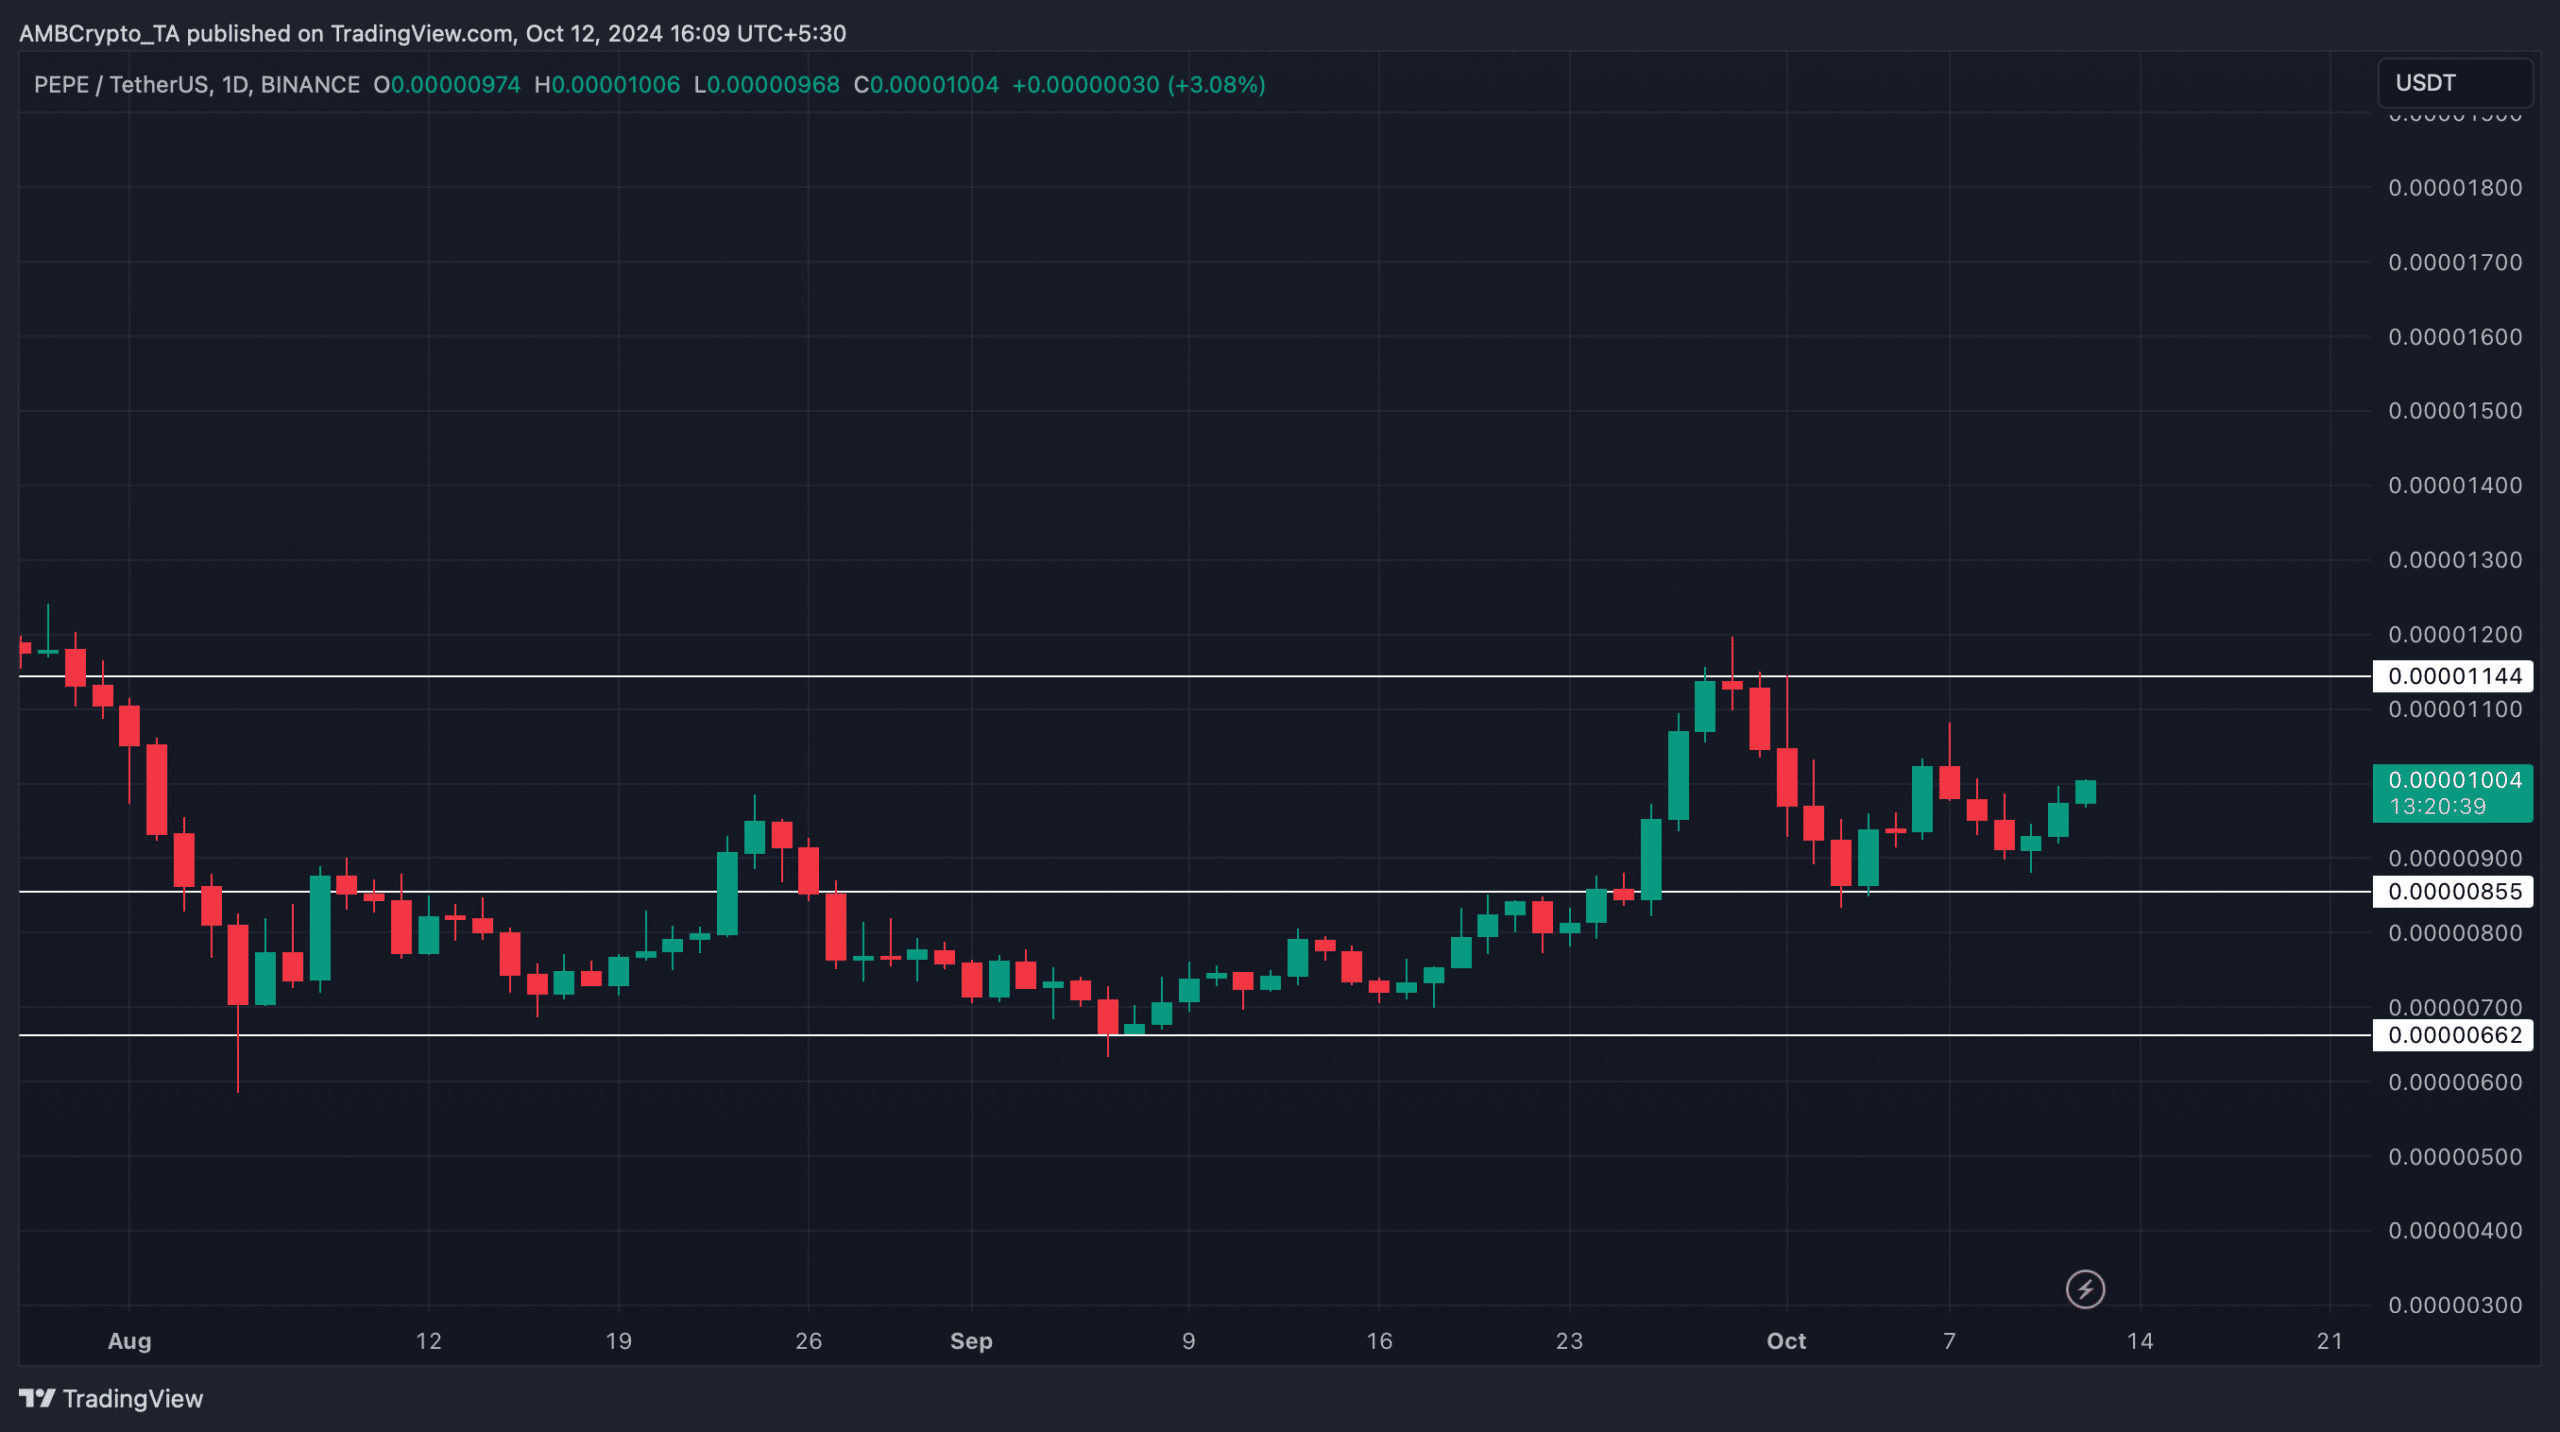
We found that in case of a price correction, the memecoin might drop to $0.0000085.
Realistic or not, here’s PEPE’s market cap in BTC’s terms
A further decline could push PEPE down to $0.0000066. However, if the bullish trend continues, then the memecoin might approach its resistance at $0.0000114 in the coming days.


Source: TradingView

