
- ONDO confirmed falling wedge breakout, surging by 4.31% to $0.7122.
- Market sentiment seemed cautious as on-chain data flashed mixed signals
Ondo [ONDO] confirmed a falling wedge breakout on the daily chart, surging by 4.31% to hit $0.7122 at press time. This pattern can be interpreted as a sign of a potential shift from a downtrend to an uptrend – A sign that ONDO might see a sustained rally.
The key question is whether this breakout will continue to drive ONDO’s price higher. Can it set the stage for further gains in the coming days?
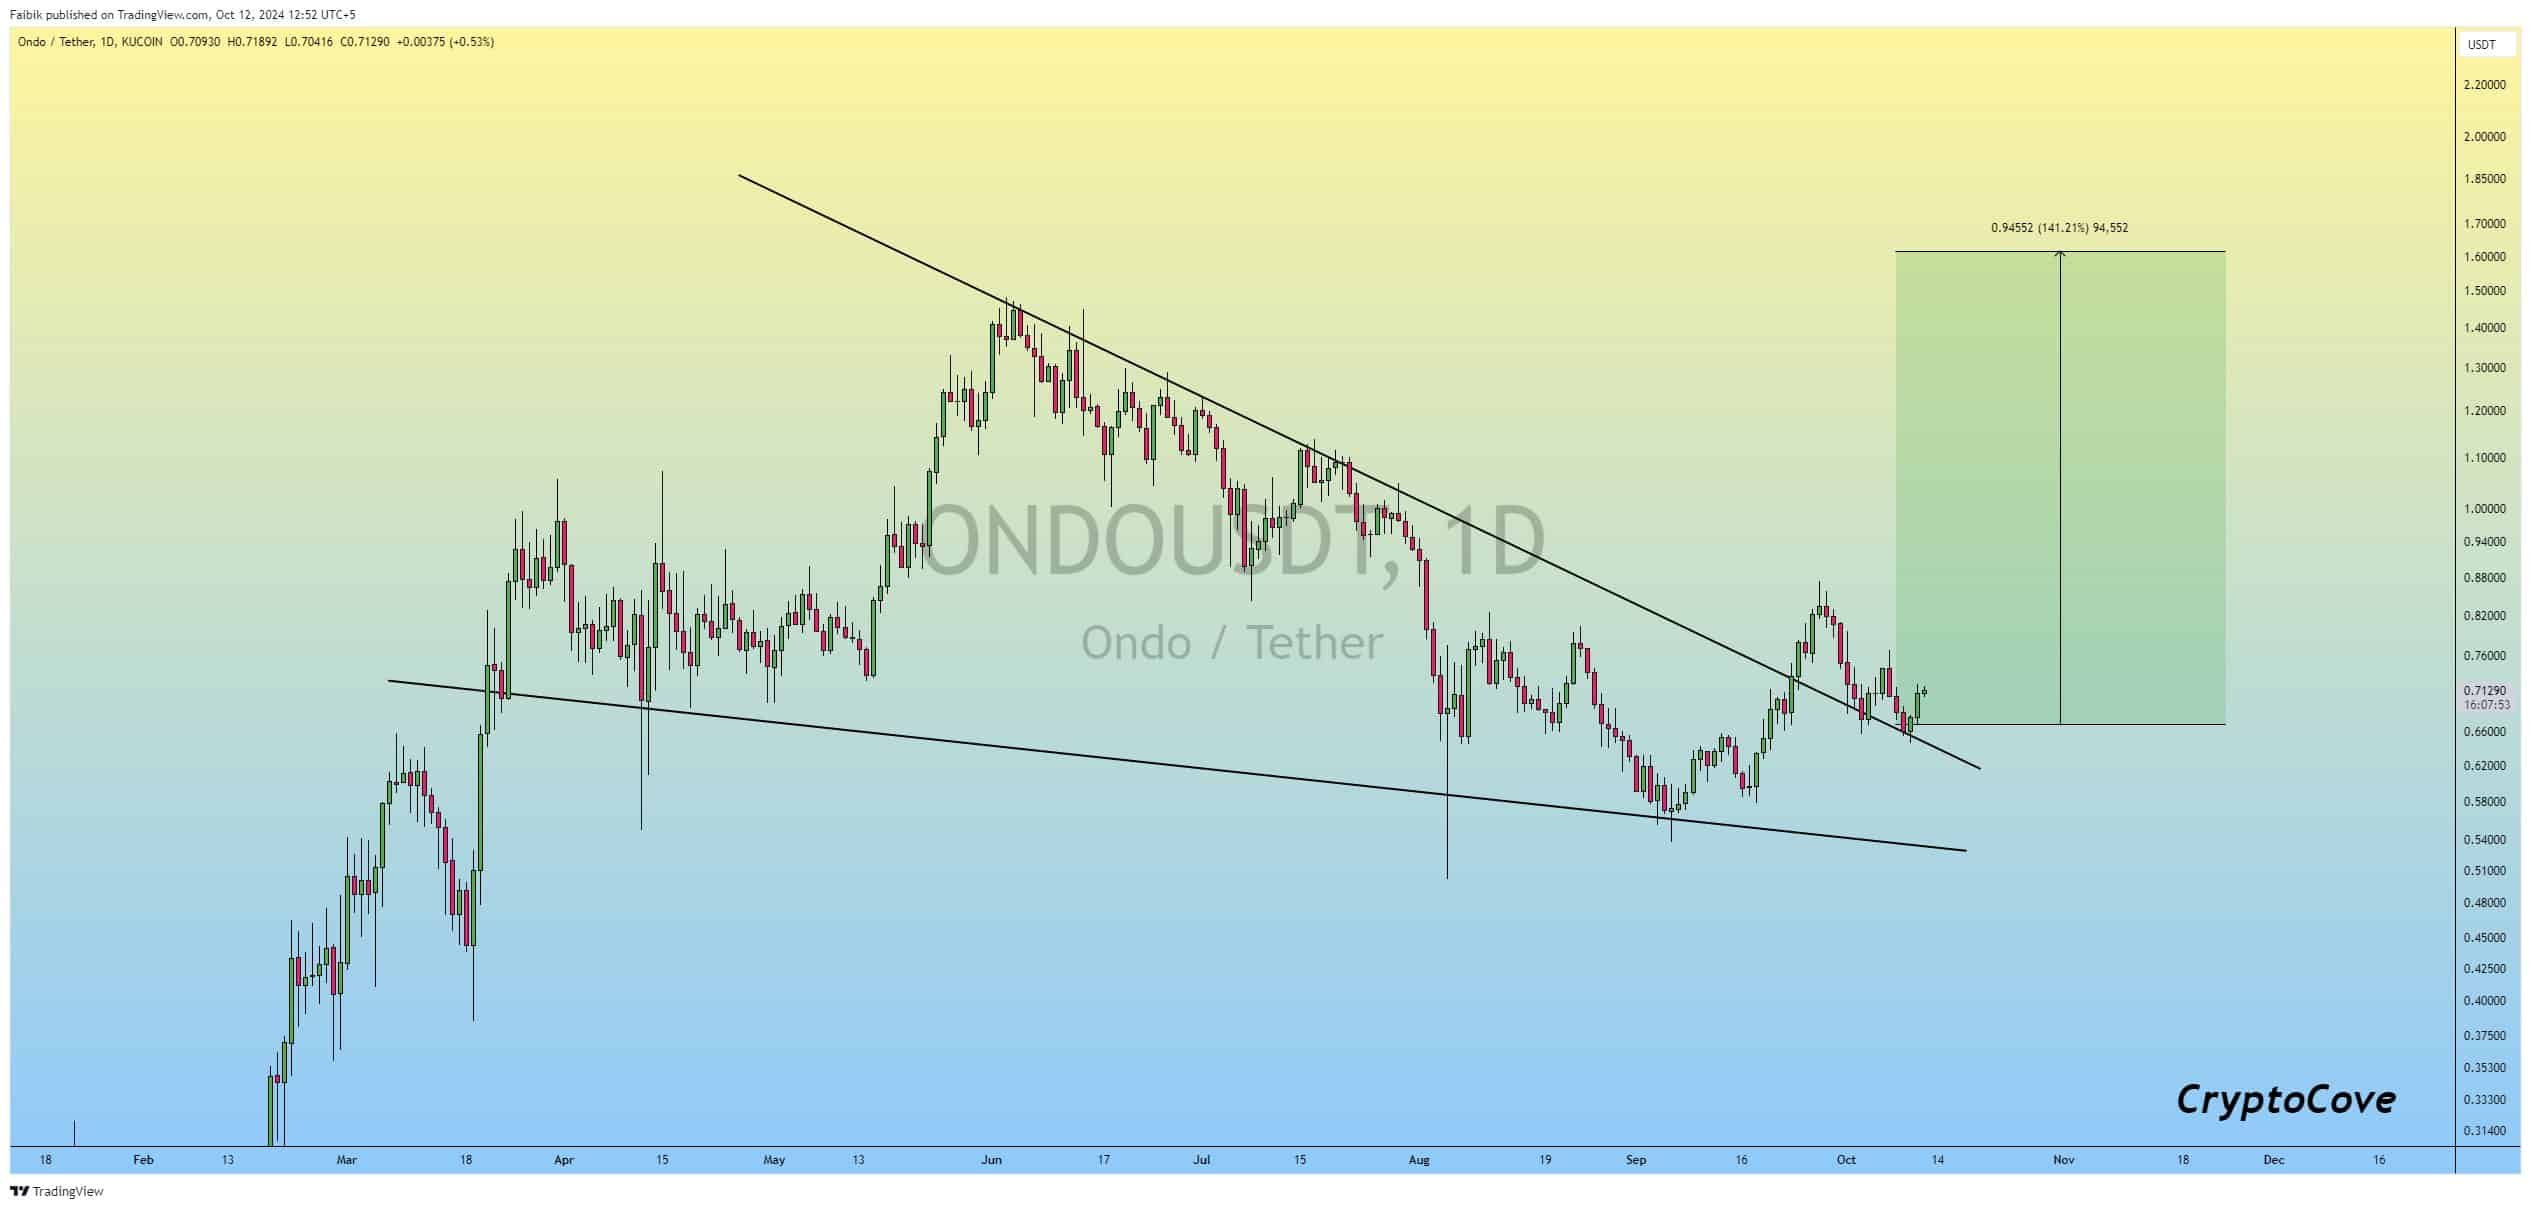
Source: Captain Faibik/X
Technical analysis breakdown – RSI and MACD show mixed signals
The altcoin’s technical indicators presented a mixed outlook. ONDO’s Relative Strength Index (RSI) had a reading of 62.25, indicating that the asset may be approaching an overbought condition. However, it still seemed to have room for additional growth on the chart.
The Moving Average Convergence Divergence (MACD), at press time, was closing in on a bearish crossover. While the chart did suggest there is still time before that happens, a bout of price depreciation might hit the market once it does. Hence, traders should remain cautious given the larger market conditions.
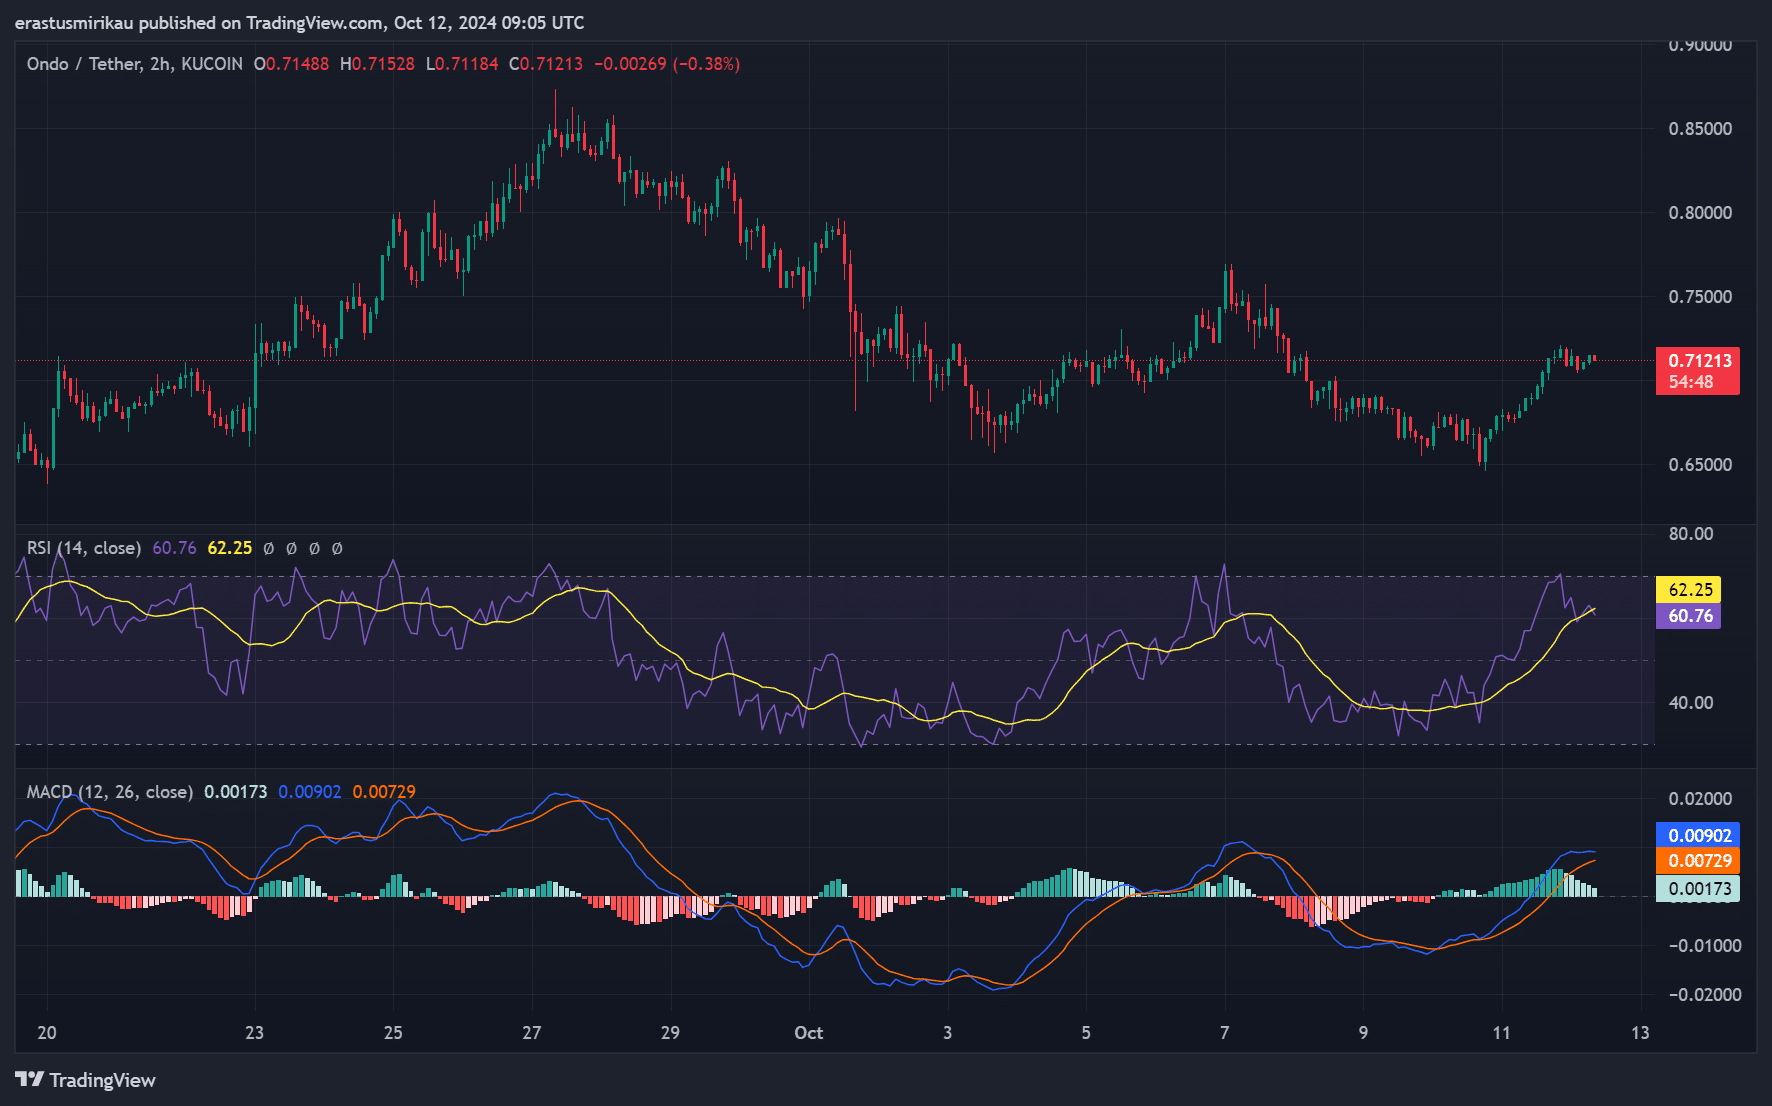
Source: TradingView
On-chain signals – Can investors expect more gains?
On-chain metrics revealed a slightly bearish sentiment. According to IntoTheBlock, for instance, net network growth fell by 1.23% – An indication that fewer participants are joining the ONDO ecosystem.
Additionally, concentration dropped by 0.03%, highlighting a lack of significant investment by large holders. Large transactions fell by 2.90% too, which seemed to support the idea of a more cautious approach.
The “In the Money” metric remained neutral at 0.01% though, showing that most investors are at a breakeven point right now. Simply put, it seemed to contribute to the uncertainty around ONDO’s future moves.
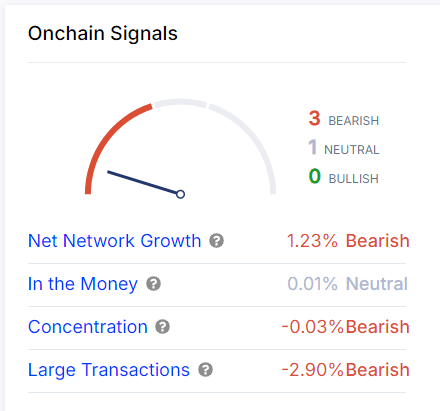
Source: IntoTheBlock
ONDO liquidation and long/short ratios: What are the traders thinking?
Finally, the liquidation charts revealed that $12.08k in short positions were liquidated compared to $3.31k in long positions. This underlined a slight bias towards selling pressure, as per Coinglass data.
However, the long/short ratio was fairly balanced at 0.99, with 50.25% short and 49.75% long positions. Therefore, traders seemed to be evenly split on whether ONDO will continue to rise or not.
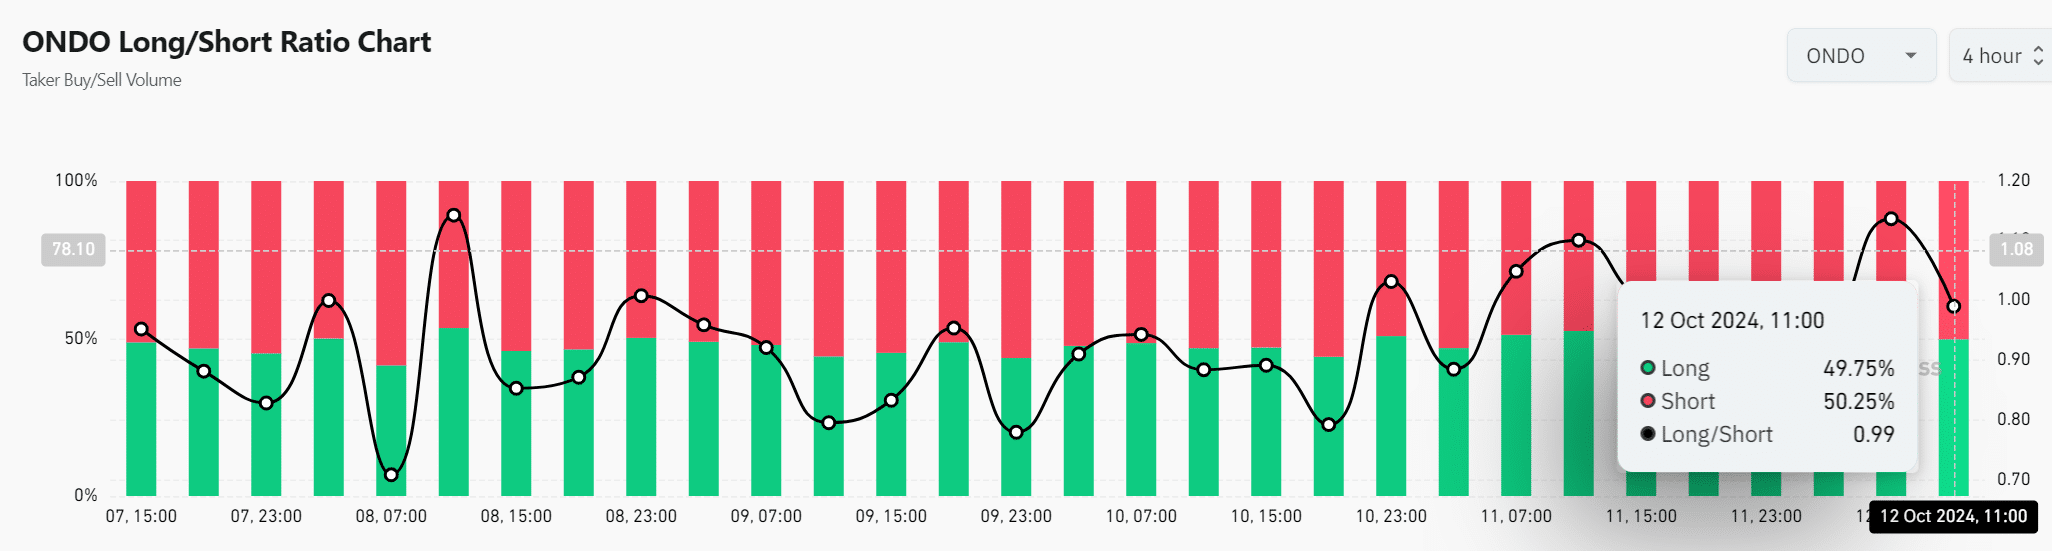
Source: Coinglass
Read Ondo’s [ONDO] Price Prediction 2024–2025
What’s next for ONDO?
Conclusively, ONDO’s falling wedge breakout has sparked hope for a bullish rally. However, conflicting technical and on-chain signals suggest traders should remain cautious.
While there is potential for sustained upward movement, the current market is evenly split. And, investors should closely monitor key indicators before making significant decisions.