- Bitcoin faces key resistance at the $63.9k level.
- Profit-taking activity is natural during price appreciation and does not necessarily mark cycle tops.
Bitcoin [BTC] has been trending downward since April on the higher timeframe price charts such as the weekly.
The daily timeframes showed more volatility, such as the 22% price surge in July from $56k to $68k or the more recent pump from $55k to $64k, a 17.5% move in the past two weeks.
Is the Bitcoin bull run over?
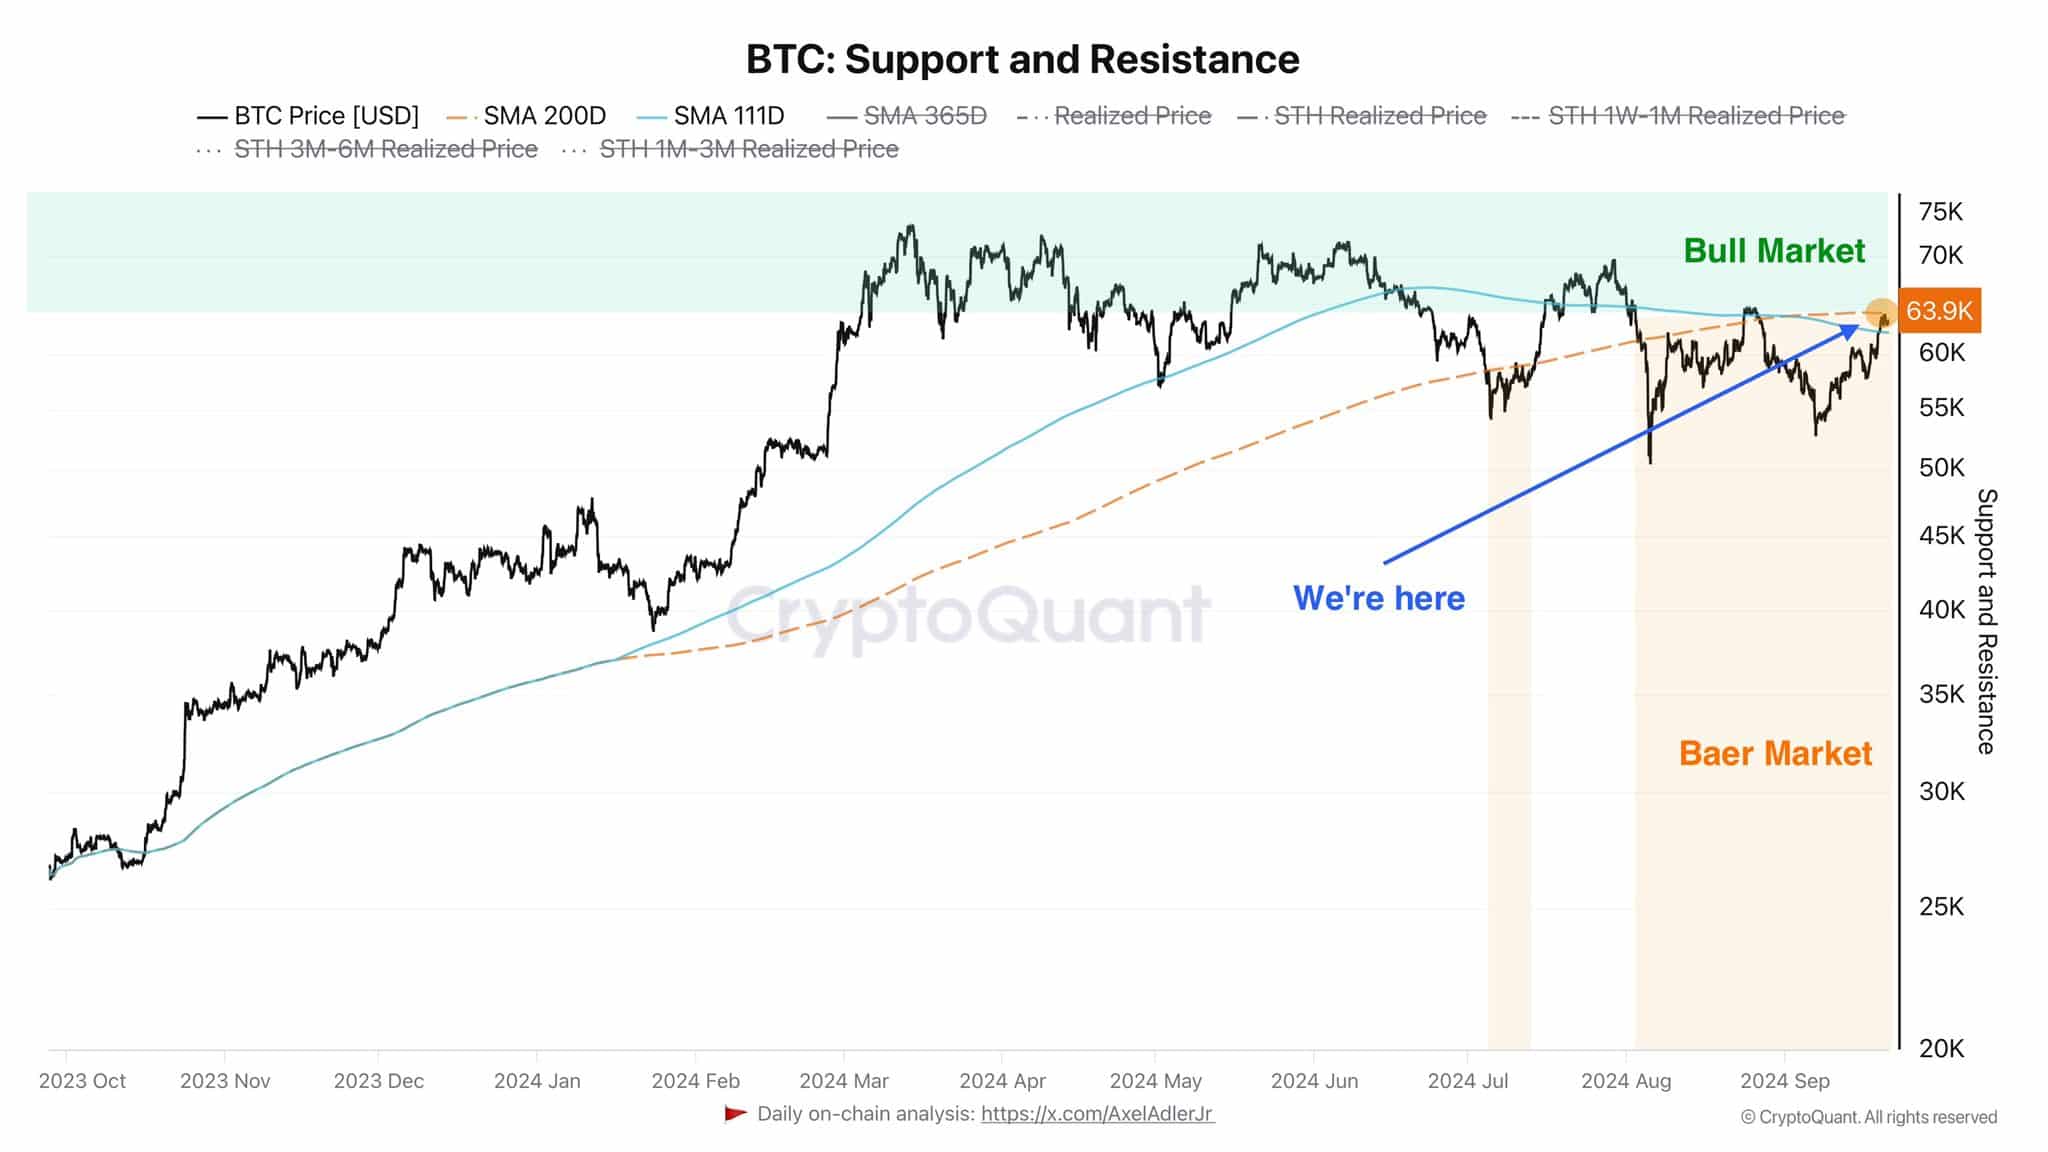
Source: Axel Adler on X
As crypto analyst Axel Adler noted in a post on X, the formal transition to a bull market is not far away. The 200-day moving average at $63.9k needs to be breached and flipped into support.
Many market participants were convinced that the rally to $73.7k in March marked the end of the bull run and that the Bitcoin halving might not usher in another run since the cycle dynamics have changed.
The chart above shows that the October 2023-June 2024 was a bullish trend, but was this the true bull run? For example, in the previous cycle, the period from the Covid crash to the 2020 halving in May saw Bitcoin gain 157% in 10 weeks.
Therefore, a sizeable price rally into the halving event is not unprecedented. The length of the bullish period was rather long, extended by the Bitcoin spot ETF approval. Each cycle has its differences.
Holders’ behavior showed a market top was likely not yet in
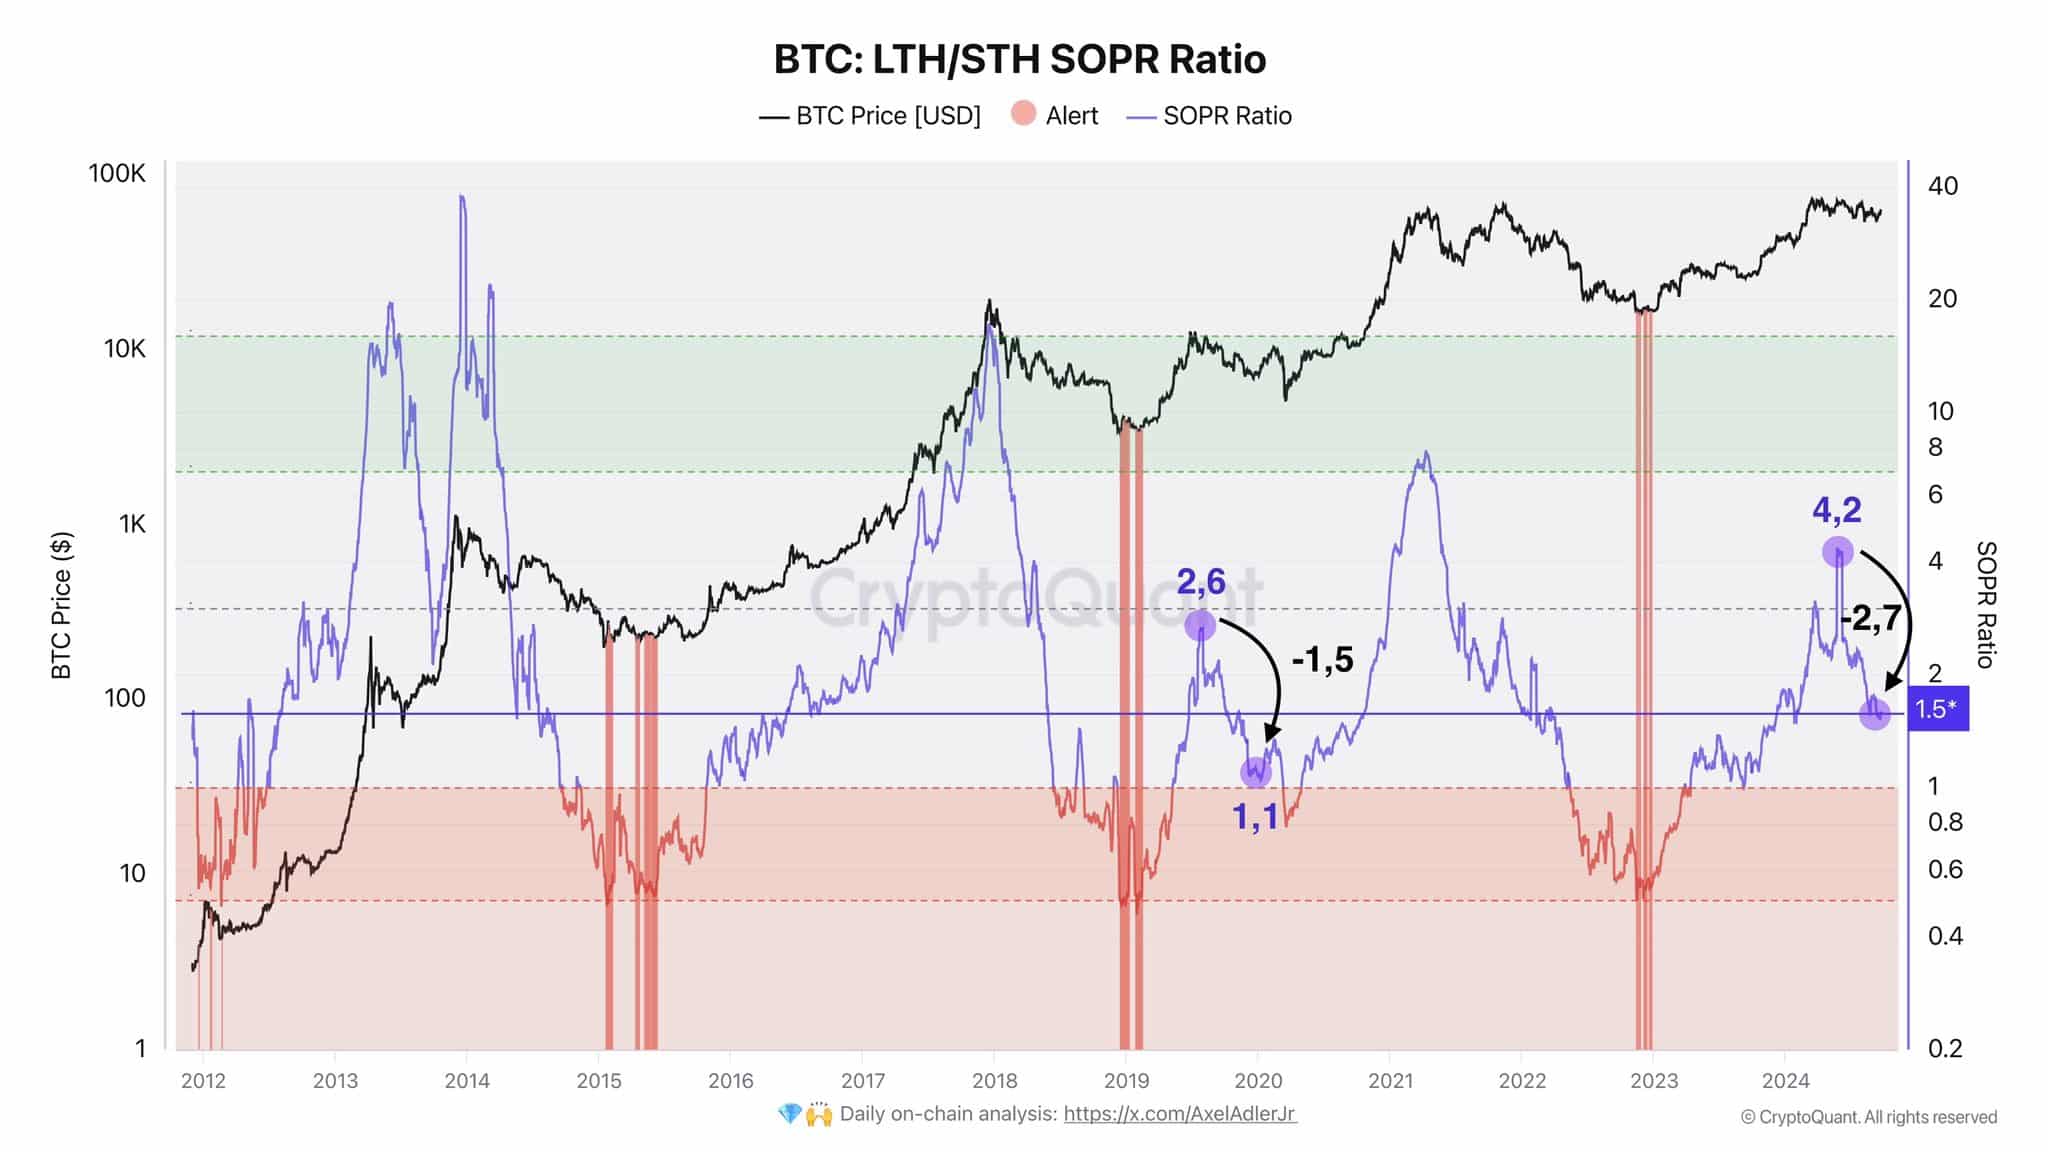
Source: Axel Adler on X
Another chart from the same analyst showed that price appreciation periods are naturally accompanied by holders taking profits. This by itself does not mean the bull run is over.
Additionally, the long-term holder/short-term holder spent output profit ratio (LTH/STH SOPR) was yet to push past the 7. This was a trend that marked the tops of the previous two cycles.
Read Bitcoin’s [BTC] Price Prediction 2024-25
The period before the previous bull run saw a large price appreciation in 2019. This move was used to take profits. This took the SOPR from 2.6 to 1.1. Similarly the selling pressure of the past five months saw the metric go from 4.2 to 1.5.
Overall, the metrics still supported the idea of further price expansion for Bitcoin in the coming months.