- BTC made significant gains in the past day, rising by 2.08%.
- Despite the recent gains, Bitcoin remained stuck in a sustained bear phase.
Over the last 24 hours, Bitcoin [BTC] has made significant gains, rising from a local low of $55554 to $58038 at press time. This marked a 2.08% increase over the past day.
These gains are coupled with weekly gains of 1.83% a recovery from a sharp decline to $52546.
These current market conditions raise the question of whether BTC will experience a sustained recovery or a mere correction before further dip. The market sentiment remains bearish as analysts see a potential dip.
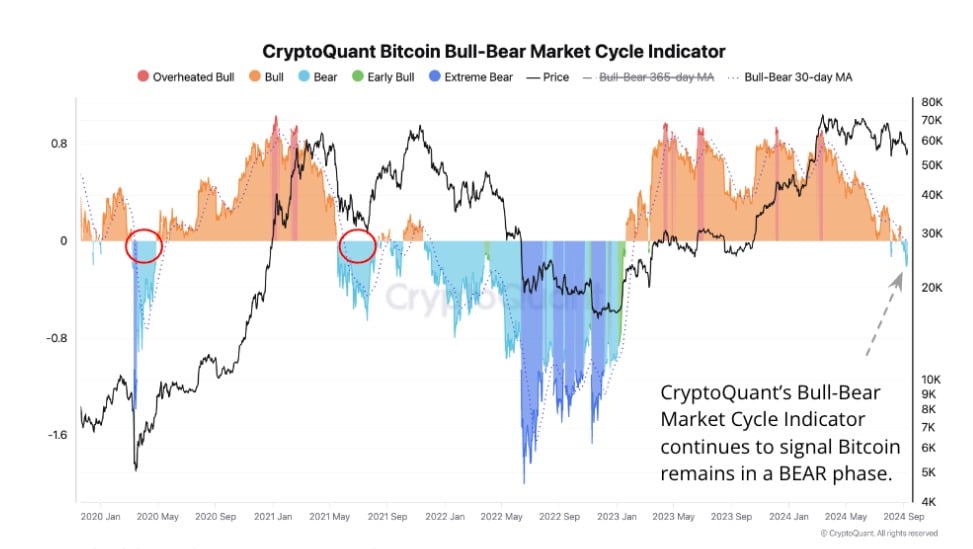
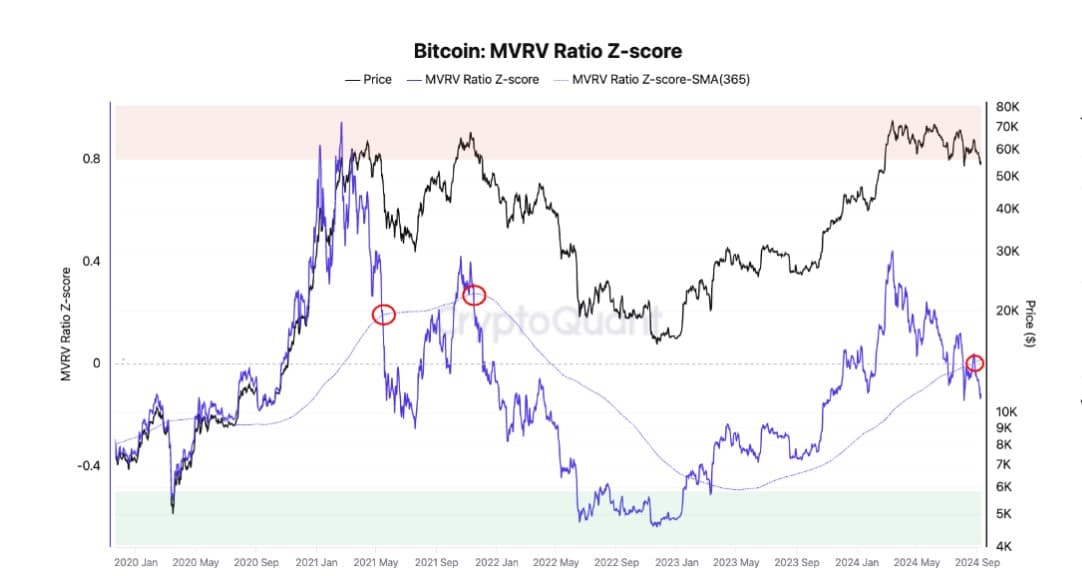
This sentiment is shared by CryptoQuant analysts who posit that BTC is stuck in a bear phase, citing the 365-day moving average and MVRV.
BTC stuck in bear phase
According to CryptoQuant, the Bull-Bear Market cycle has remained in the bear phase over the past two weeks.
Since the last time BTC was trading at $62k, the crypto has remained in a bear phase, dropping to a low of $52k in this period.
As long as it remains in this phase, a significant rally remains unexpected with potential for further correction.
Source: CryptoQuant
Secondly, the analysis cited that BTC’s MVRV ratio has remained below its 365-day moving average since the 26th of August. Such a scenario suggests the potential for a further decline, as was witnessed in May 2021.
During the 2021 cycle, BTC declined by 36% in two months — this reoccurred in November 2021.

Source: CryptoQuant
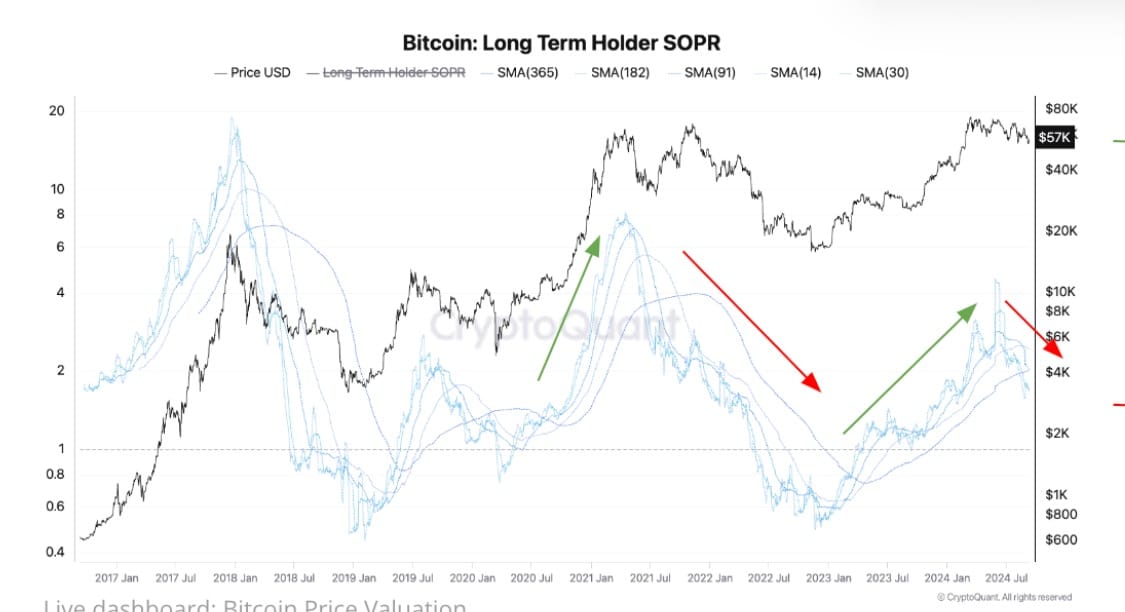
Another market indicator signaling a bearish trend is the long-term holders’ SOPR. According to CryptoQuant, long-term holders’ SOPR has declined since July, with LTH spending at lower profit margins.
When LTHs spend at lower profit margins, it shows a lack of new demand for BTC. Thus, BTC will only show a buying signal when LTH SOPR charts start an uptrend movement.
Source: CryptoQuant
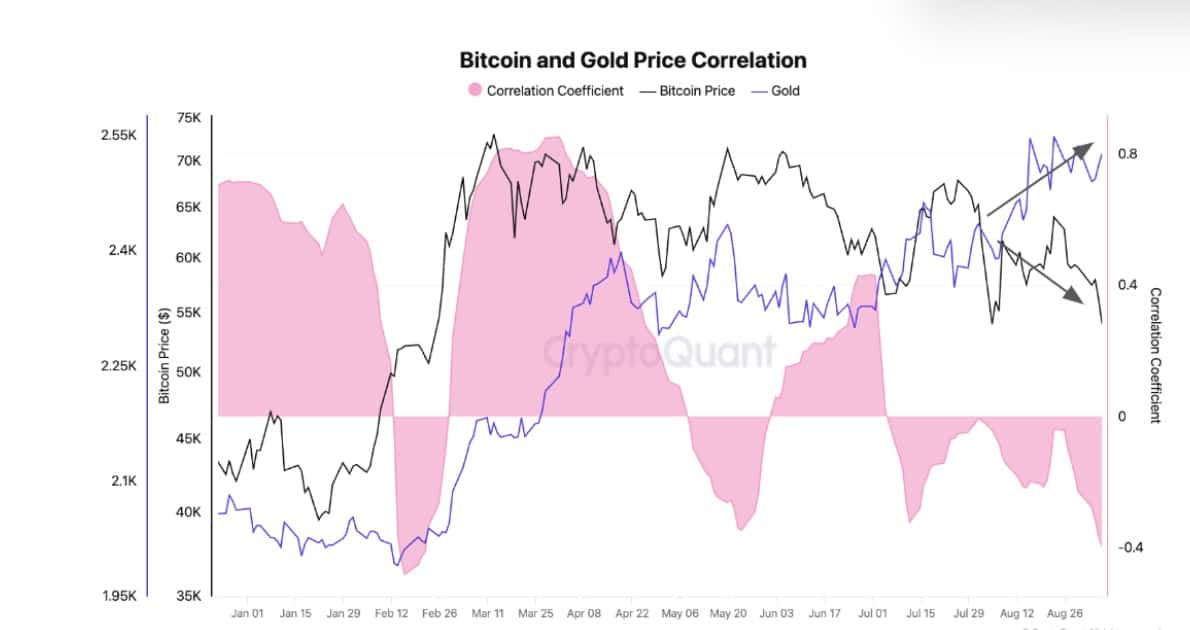
Finally, BTC has decoupled from gold as its prices have declined while gold prices have been soaring, hitting new highs. Thus, the correlation between gold and BTC has turned negative, where gold’s price increased as BTC declined.
This suggested that investors were becoming risk-averse as they turned to traditional assets as a safe haven, thus avoiding volatile assets.
Source: CryptoQuant
What Bitcoin’s charts suggest
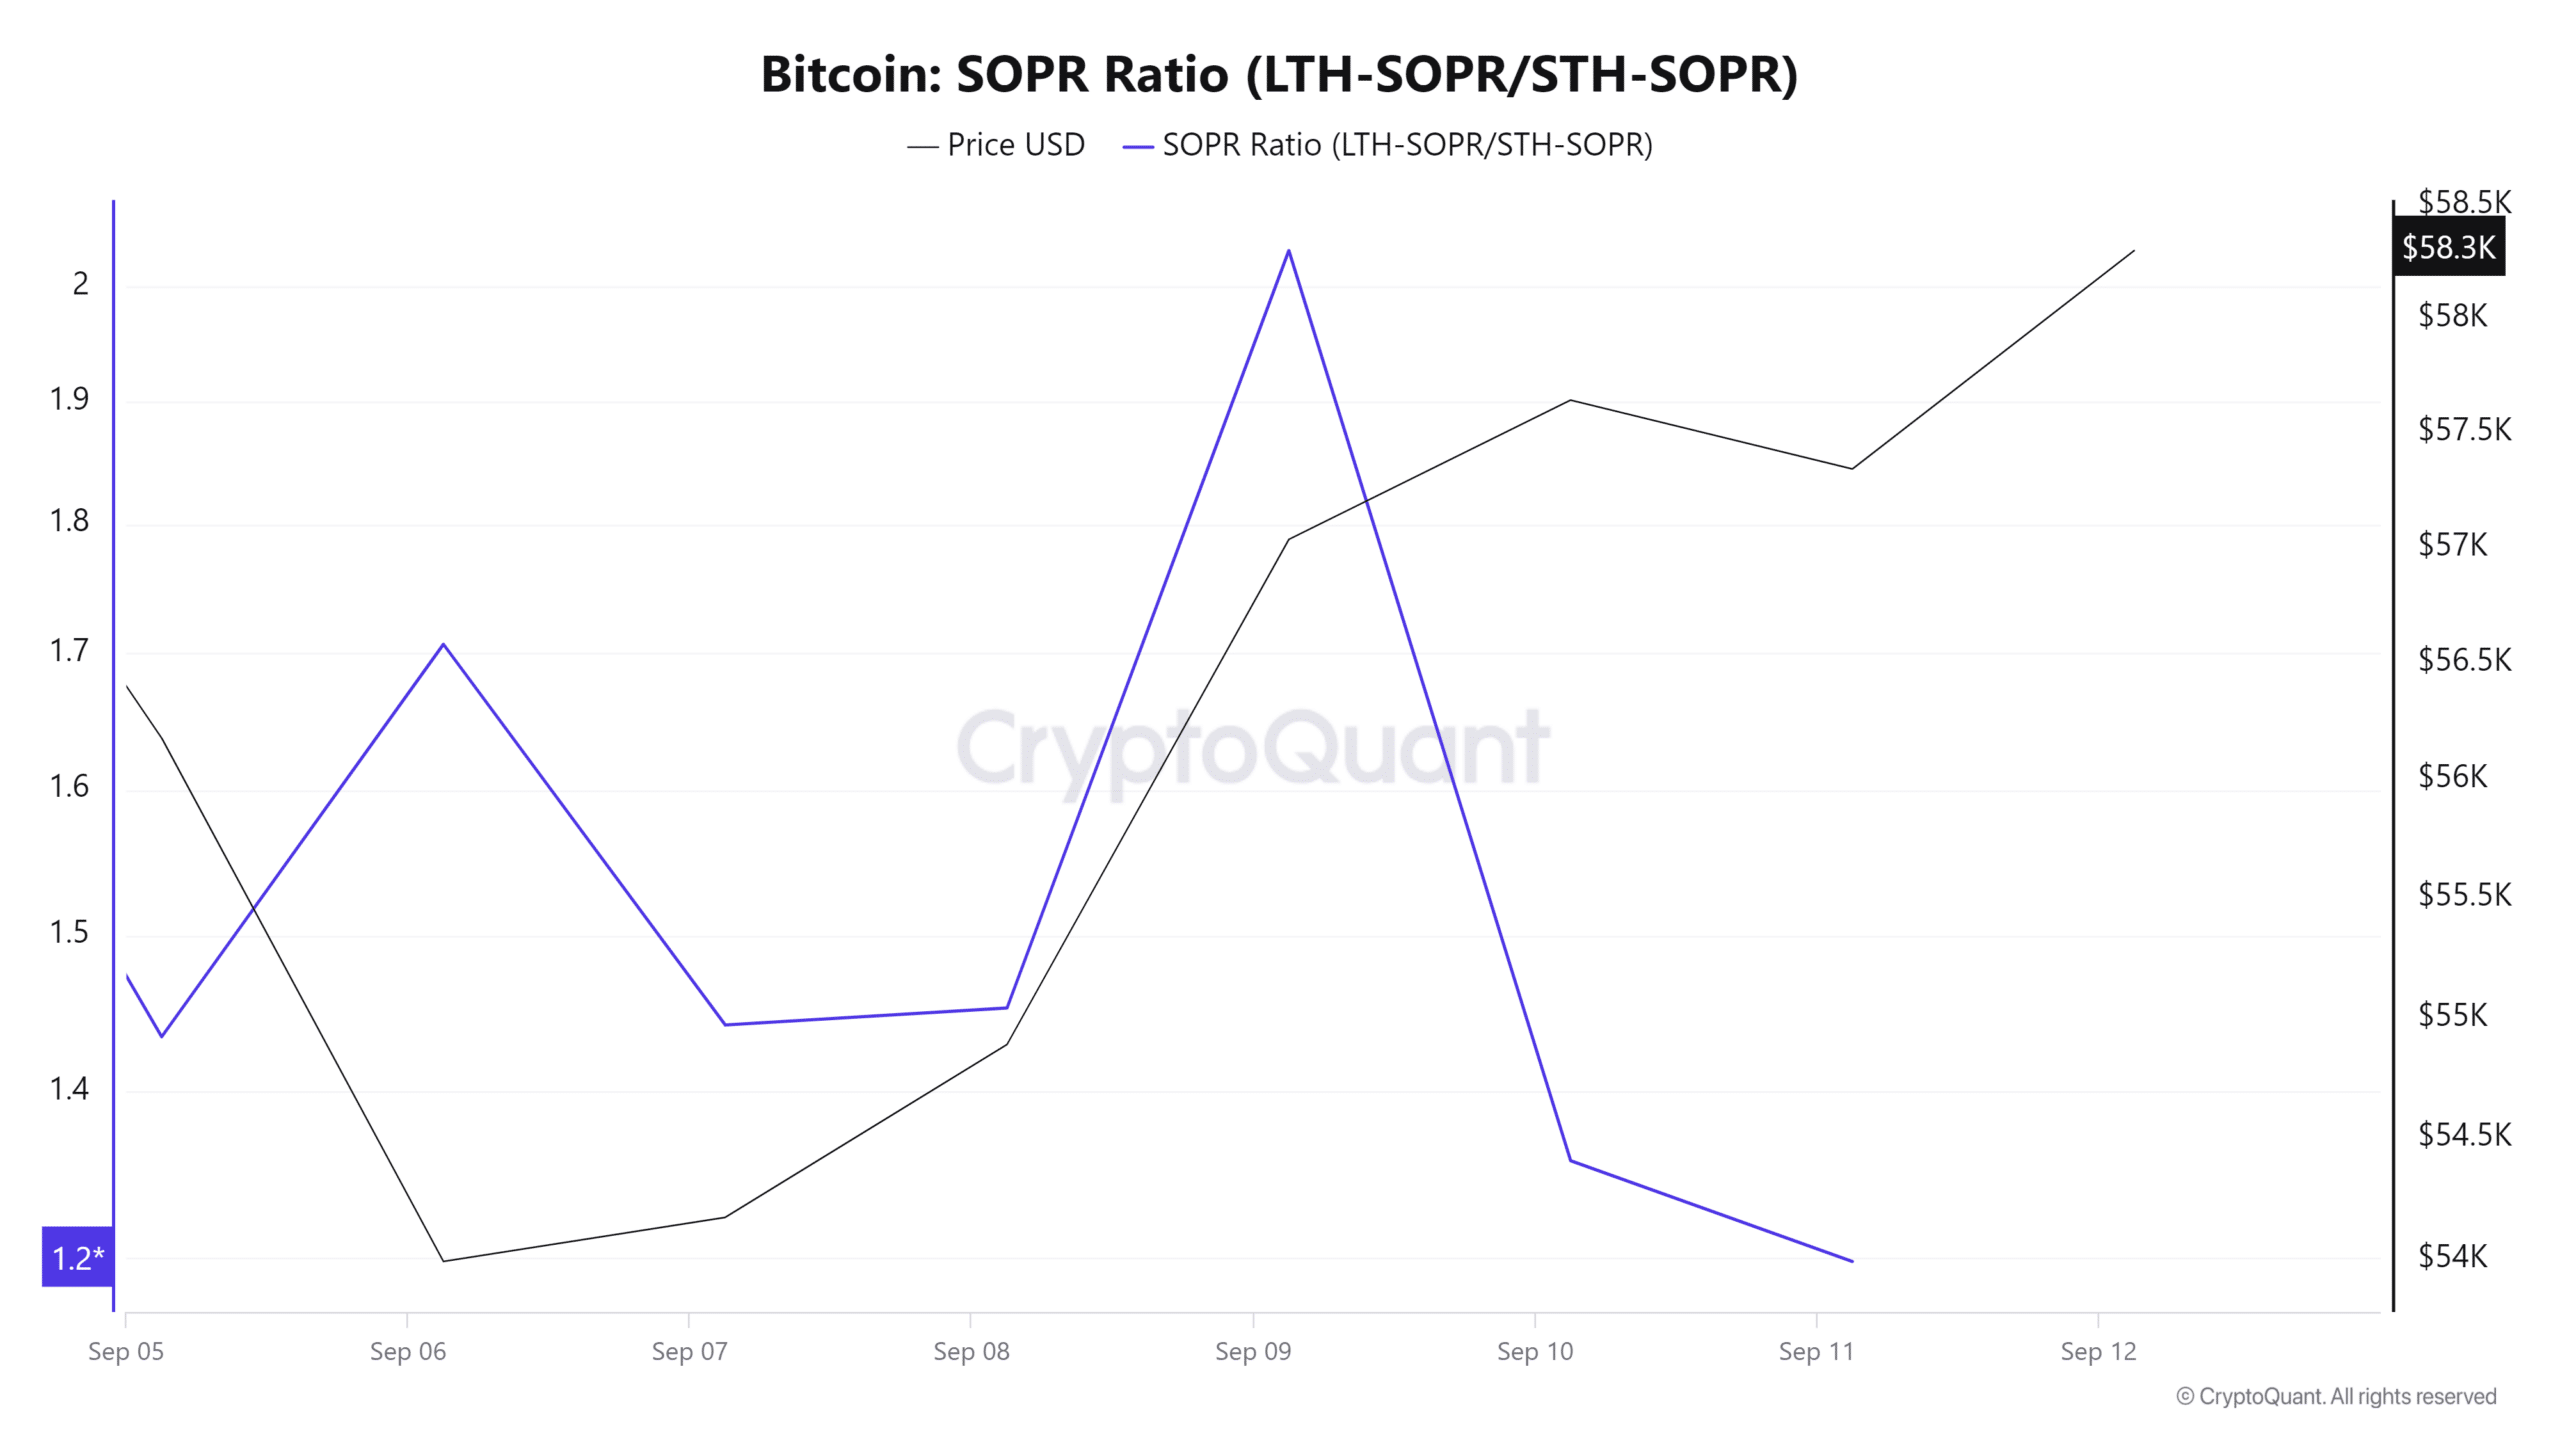
Looking ahead, both Bitcoin’s LTH-SOPR and STH-SOPR declined over the past week. When the LTH-SOPR declines, it suggests that long-term holders were increasingly selling their crypto at a loss.
When the STH-SOPR declines, it indicates that short short-term holders are also selling at a loss, due to FUD and fear of further downside.

Source: CryptoQuant
Read Bitcoin’s [BTC] Price Prediction 2024–2025
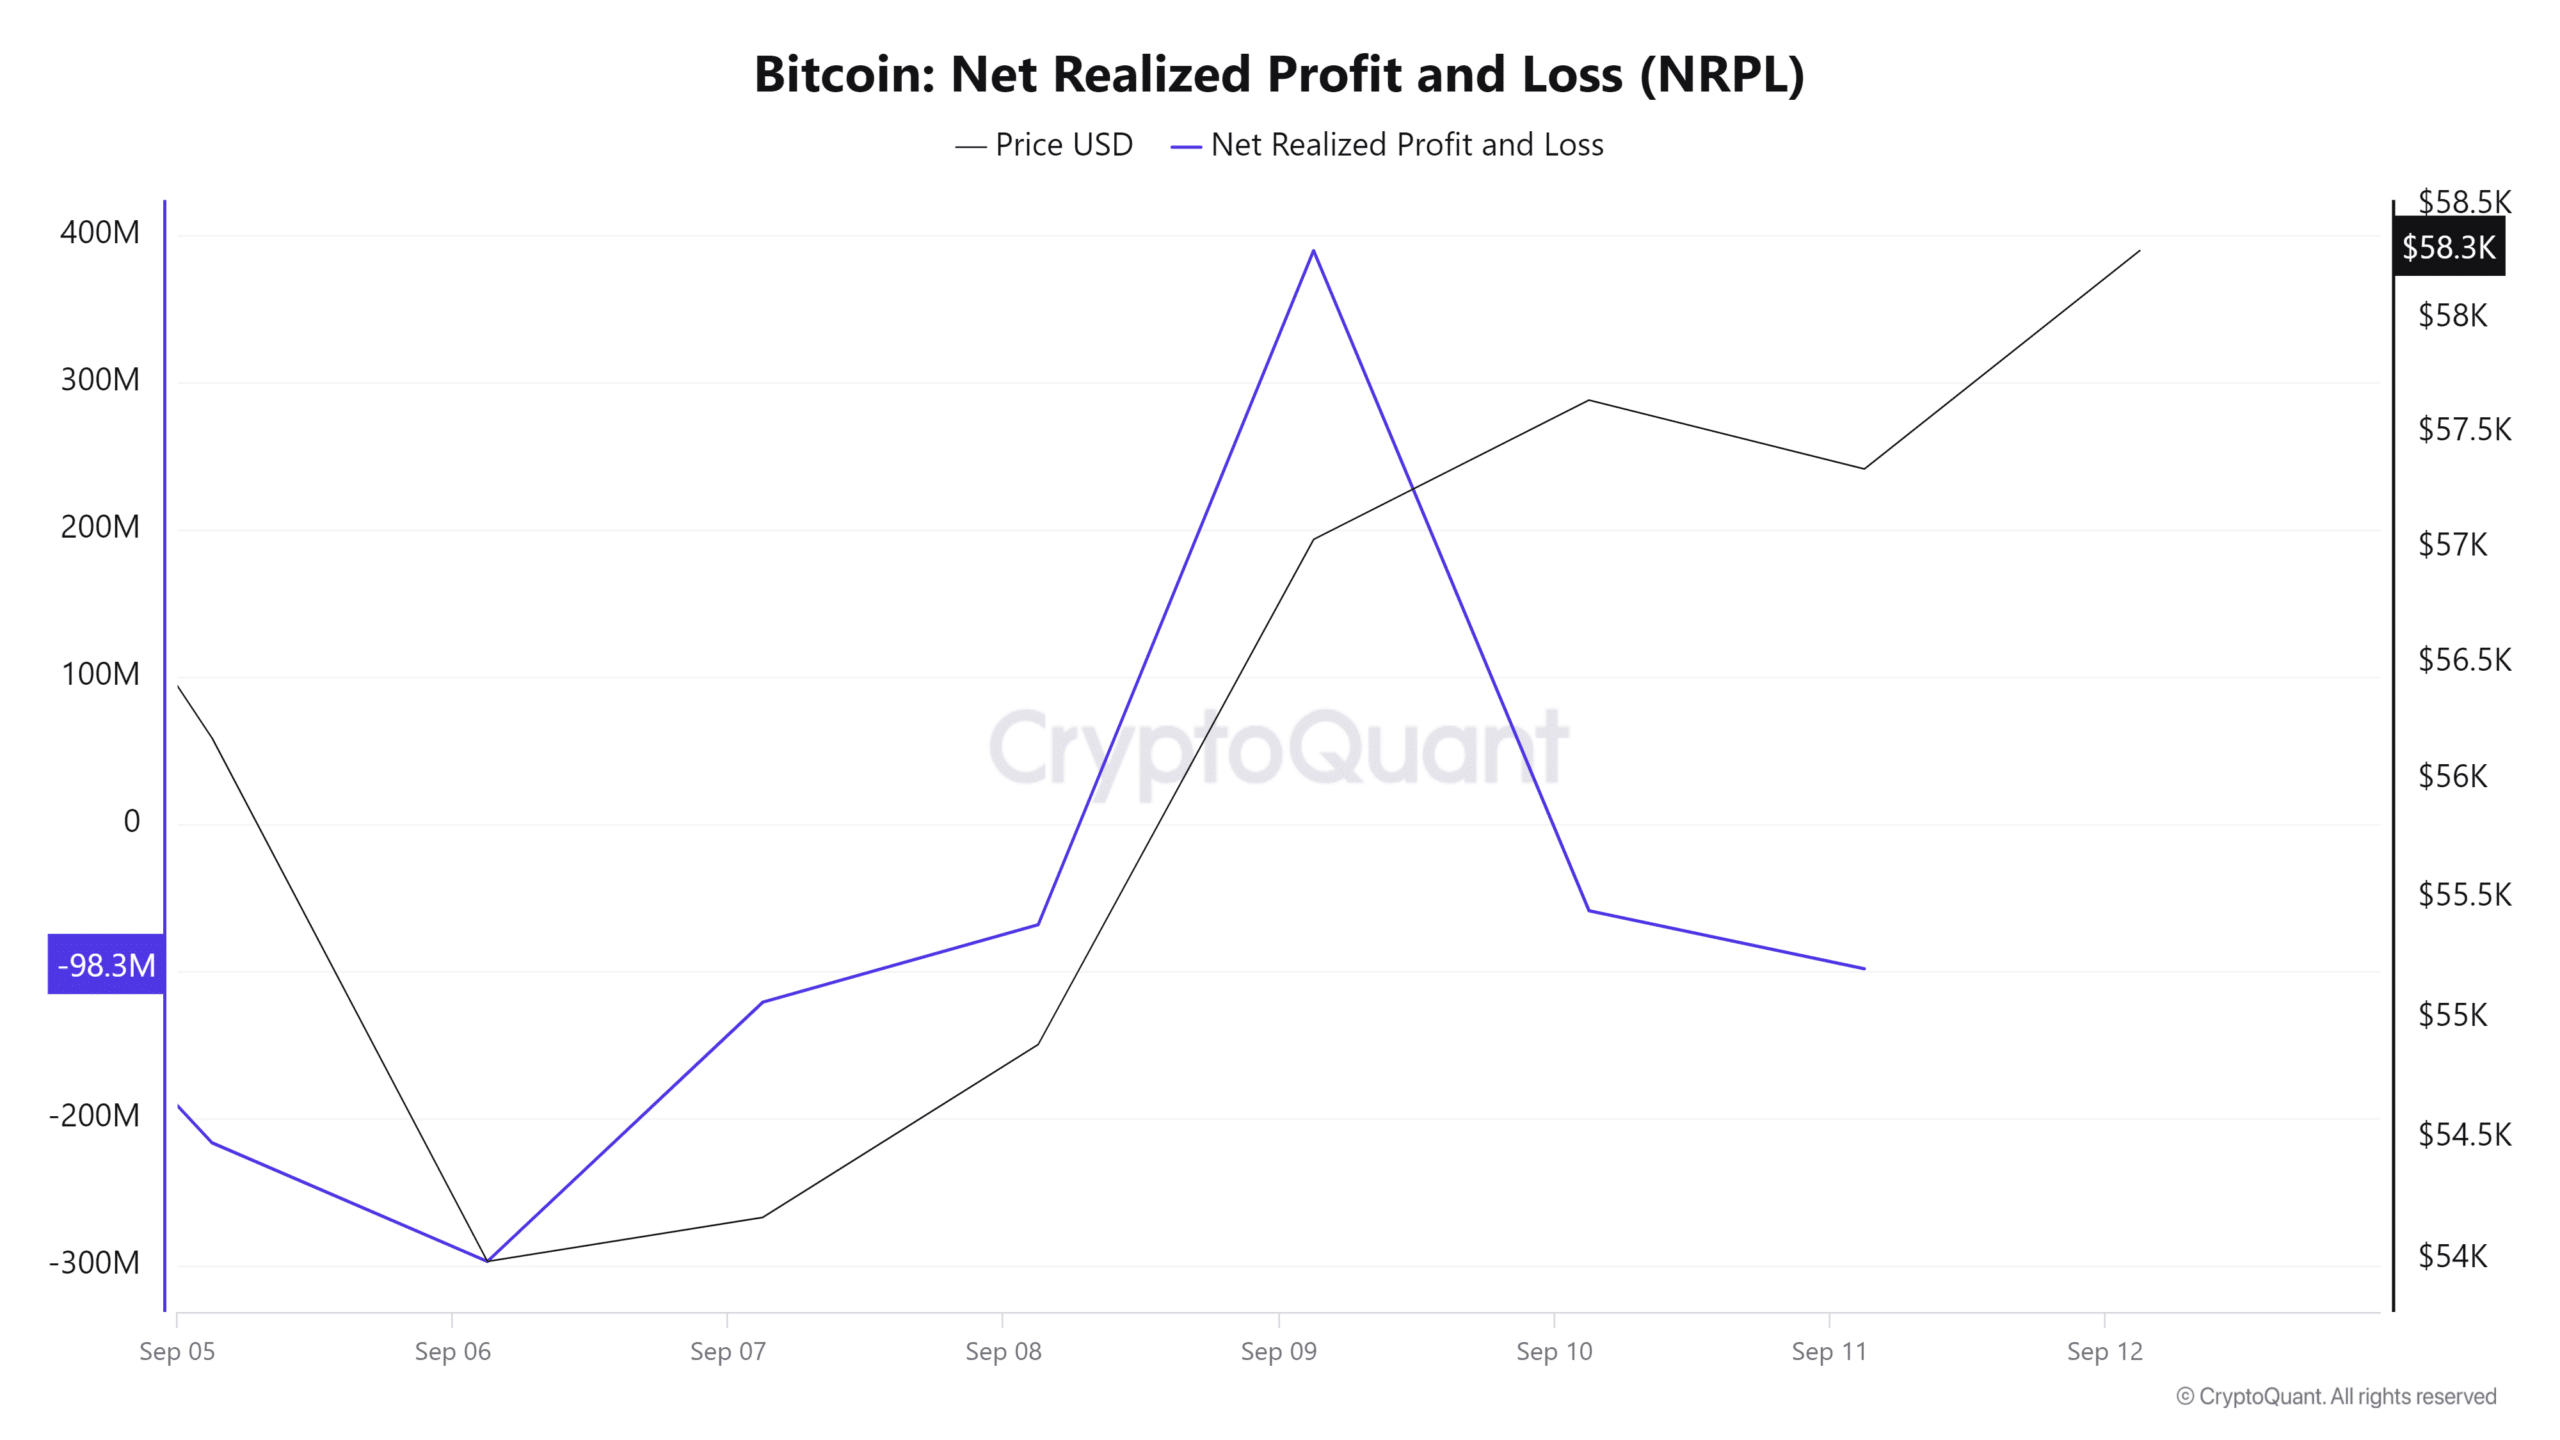
Additionally, Bitcoin’s NRPL has turned from positive to negative, indicating capitulation. This meant that investors have lost confidence in the crypto’s direction and were selling regardless of their losses.
Therefore, based on this analysis, BTC’s bear phase will continue, and the prices are likely to experience continued corrections. Thus, if bears continue to dominate, Bitcoin will drop to the $56k support level.

Source: CryptoQuant

