- Selling pressure on Ethereum was rising over the past few days.
- The NVT ratio indicated that Ethereum was overvalued.
Ethereum [ETH] investors were having a tough time as the bears continued to dominate the market. In fact, the latest data suggested that it might take even longer for the bulls to regain control.
Let’s have a look at why it seemed likely for ETH bears to push the token’s price down further.
Ethereum troublesome future
CoinMarketCap’s data revealed that Ethereum bears pushed the token’s price down by more than 10% in the last seven days. The bearish trend continued in the last 24 hours as ETH’s value dipped by 1.6%.
At the time of writing, Ethereum was trading at $2,486.34 with a market capitalization of over $299 billion.
As per IntoTheBlock’s data, 76.8 million ETH addresses remained in profit, which accounted for 63% of the total ETH addresses.
In the meantime, Ali, a popular crypto analyst, posted a tweet highlighting an interesting development. As per the tweet, the MVRV Momentum indicated that Ethereum was still in a downtrend.
The bad news was that there were no signs of a trend reversal. This clearly suggested that investors might witness the king of altcoins drop further in the coming days.
Therefore, AMBCrypto planned to have a closer look at ETH’s state to find out what to expect.

Source: X
ETH’s possible support levels
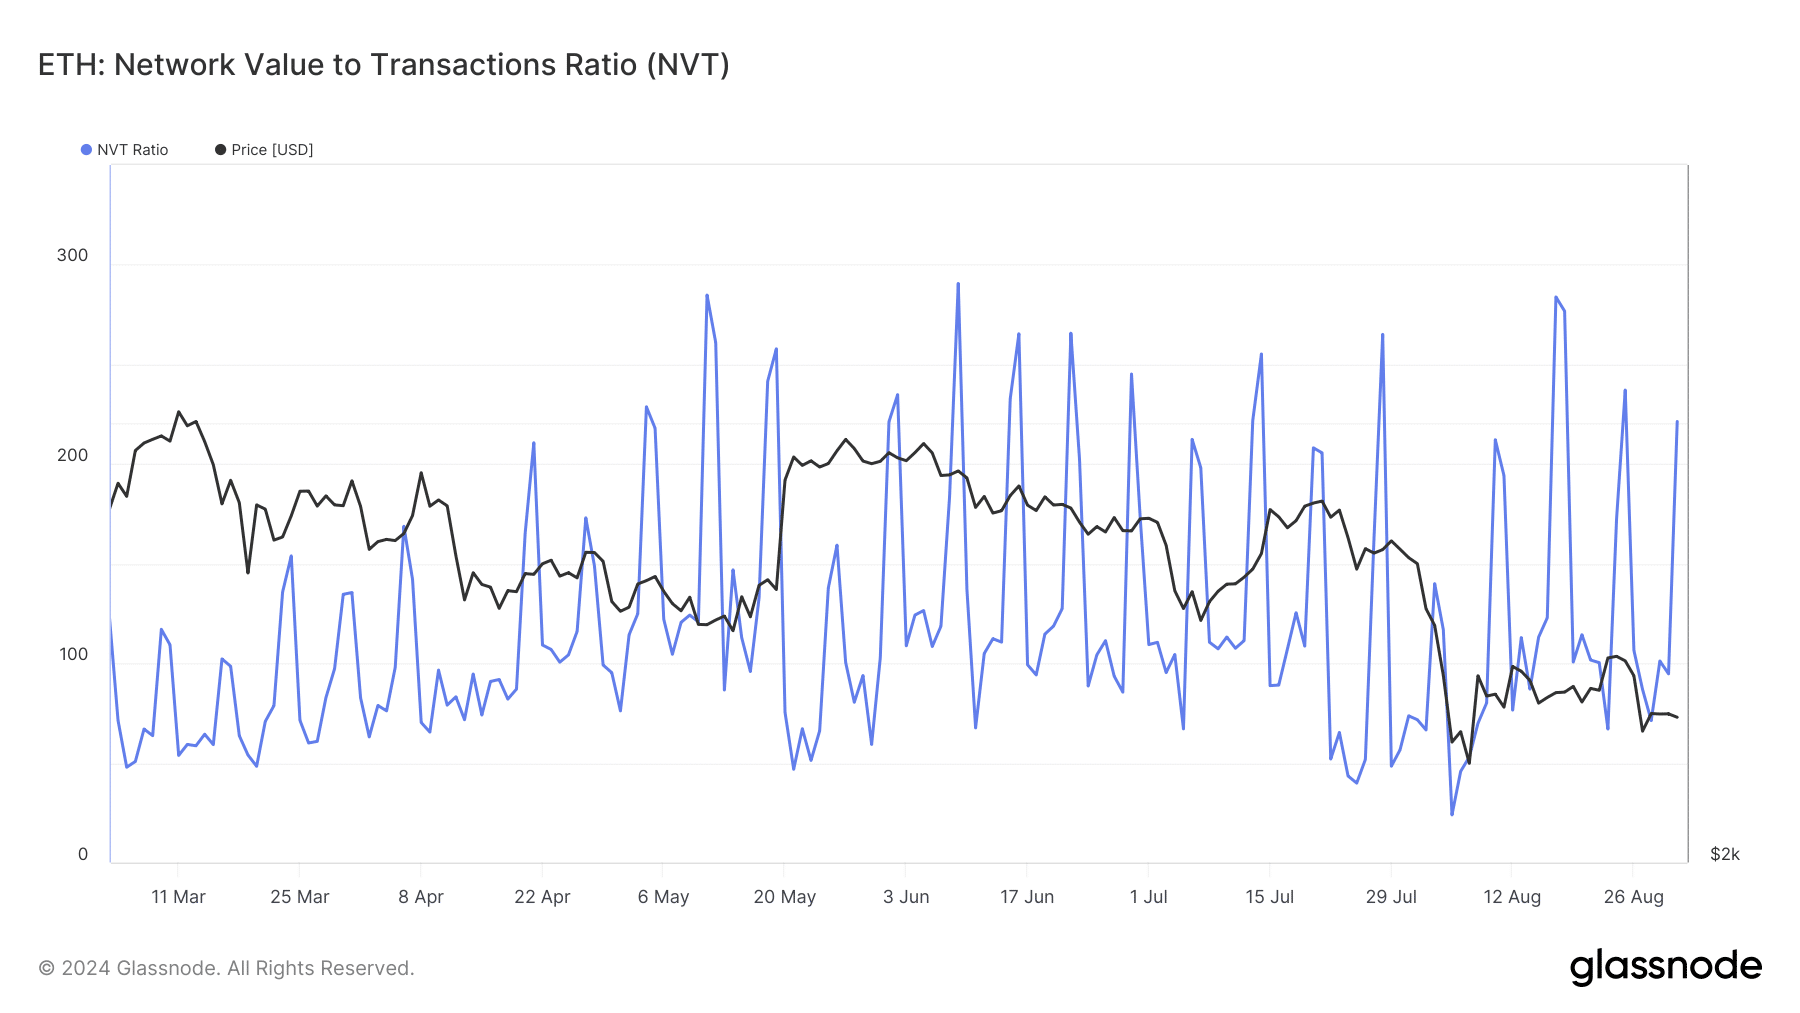
AMBCrypto’s analysis of Glassnode’s data revealed that Ethereum’s NVT ratio registered a massive spike. Whenever the metric increases, it suggests that an asset is overvalued, hinting at a price correction.


Source: Glassnode
CryptoQuant’s data also revealed quite a few bearish metrics. For example, ETH’s exchange reserve was increasing, meaning that selling pressure was on the rise.
Apart from that, the total number of coins transferred has decreased by -37.28% compared to yesterday. Another bearish metric was the active addresses, as it dropped in the last 24 hours.


Source: CryptoQuant
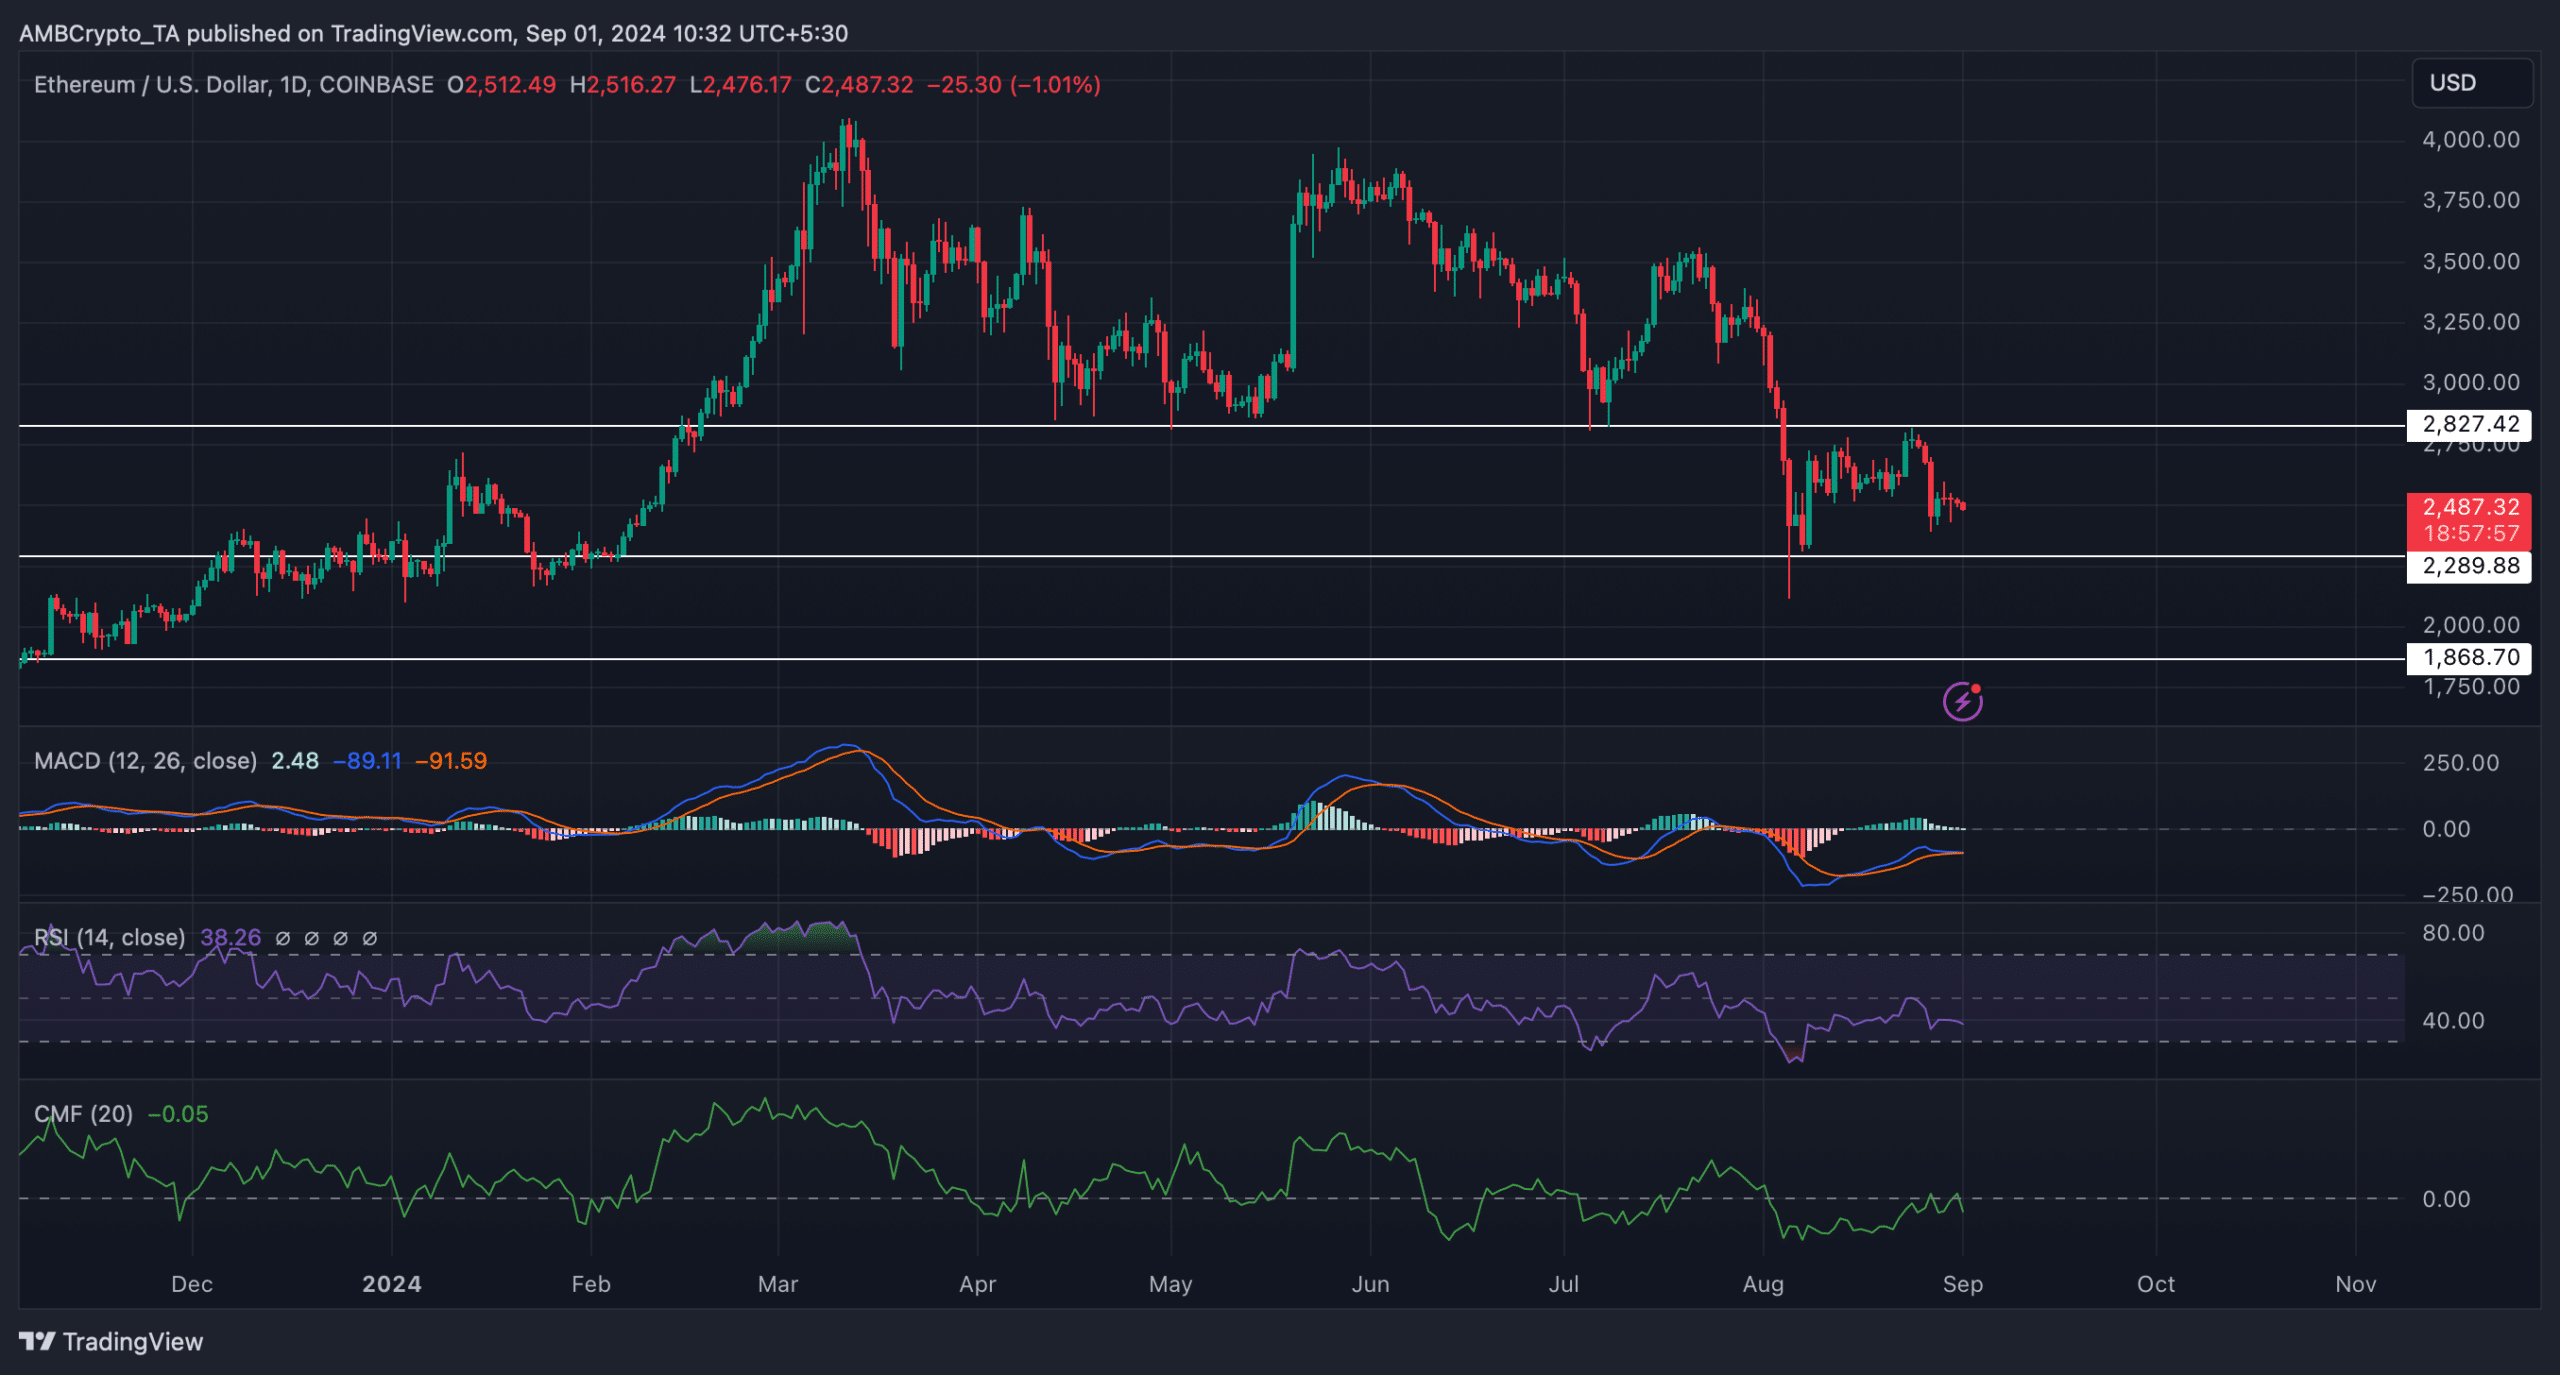
Since the aforementioned datasets hinted at a continued price drop, AMBCrypto checked Ethereum’s daily chart to look for possible support zones. The technical indicator MACD displayed a bearish c crossover. Ethereum’s Chaikin Money Flow (CMF) registered a downtick.
Read Ethereum’s [ETH] Price Prediction 2024–2025
The Relative Strength Index (RSI) also followed a similar declining route, suggesting that the chances of a further price drop were high. If that’s true, then it won’t be surprising to see Ethereum plummeting to $2.28.
A slip under that support level could push ETH down to $1.86 in the coming days or weeks if the bulls don’t buckle up.

Source: TradingView

